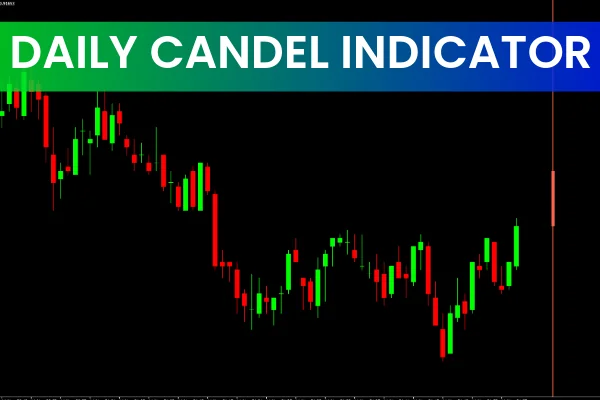
The Daily Candle Indicator is a valuable MT4 tool that displays the daily Price Action directly on any chart and any timeframe. By plotting a full daily candlestick—including the open, close, high, and low—it gives traders a clearer view of higher-timeframe structure without needing to switch charts constantly. Whether you're scalping, day trading, or trading long-term, the Daily Candle Indicator helps align your entries with the overall market trend.

What the Daily Candle Indicator Shows
The indicator draws a single candlestick representing a full 24-hour trading session. This candlestick contains four key price levels:
Open price: where the daily session began
Close price: where the daily session ended
High price: the highest value price reached
Low price: the lowest value touched
A bullish daily candle forms when the closing price is higher than the opening price.
A bearish daily candle forms when the closing price is lower than the opening price.
This simple but powerful visual representation allows traders to instantly identify the market’s dominant pressure—buying or selling.
Why Daily Candles Matter on Lower Timeframes
Many traders switch between multiple timeframes to gather confirmation. The Daily Candle Indicator eliminates this extra work by overlaying daily data directly onto any chart, including M1, M5, M15, H1, and H4.
This is especially useful for:
Scalpers who need higher-timeframe context
Day traders looking for bias confirmation
Swing traders who want to verify Market Structure
Long-term traders monitoring Trend Strength
By seeing the daily candle on a lower timeframe, you can trade with greater alignment and confidence.
How to Use the Daily Candle Indicator for MT4
The indicator’s logic is straightforward: trade in the direction of the current daily candle.
Bullish Daily Candle → Go Long
If the current daily candle is bullish:
Look for buy setups
Use price action confirmation
Favor long trades in alignment with daily momentum
Bearish Daily Candle → Go Short
If the daily candle is bearish:
Look for sell setups
Focus on bearish pattern confirmations
Avoid counter-trend trades during strong daily bias
Example: Using the Indicator on GBP/CHF (H1 Chart)
On an H1 timeframe, the Daily Candle Indicator overlays the day’s candle structure. This enables traders to:
Recognize whether bulls or bears dominate the session
Confirm whether the intraday trend aligns with the daily candle
Filter out trades that oppose the higher-timeframe direction
If the daily candle is bearish, traders favor short positions.
If the daily candle is bullish, traders favor long setups.
The indicator acts as a bias filter, helping reduce mistakes caused by trading against the major trend.
Using the Indicator with Other Tools
While the Daily Candle Indicator provides essential directional bias, it should not be used as a standalone system. It works best when combined with:
Support And Resistance levels
Moving averages
Trendlines and channels
Price action patterns
Momentum indicators
Volume analysis
Using multiple forms of confluence helps increase the probability of successful trades.
Benefits of the Daily Candle Indicator
Easy to use for all skill levels
Provides clear visual bias
Works for scalpers, day traders, and swing traders
Helps reduce noise from lower-timeframe fluctuations
Plots daily structure without switching charts
By consistently following the daily candle direction, traders can avoid low-quality setups and trade with more confidence.
Conclusion
The Daily Candle Indicator for MT4 is a simple yet powerful tool for identifying market trend direction and aligning trades with the daily bias. By plotting the daily candle on any timeframe, the indicator offers clarity, structure, and improved decision-making for all trading styles.
For more essential trading tools and indicators, visit IndicatorForest.com and upgrade your charting experience.
FAQ
5 Downloads
Published:
Nov 15, 2025 00:56 AM
Category: