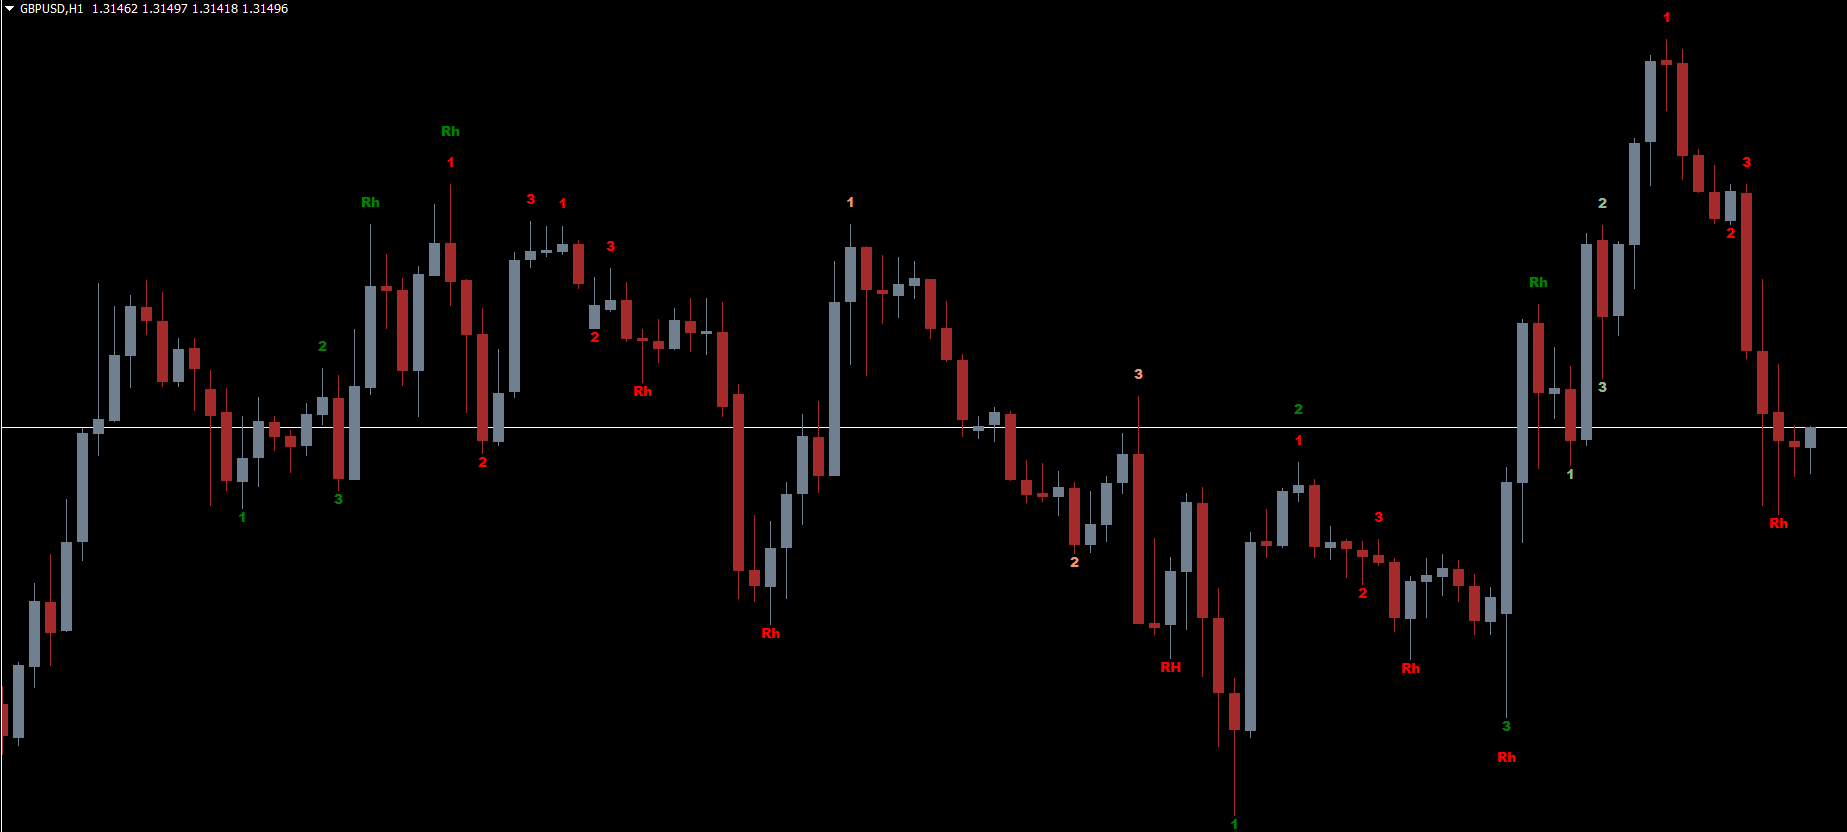
A Ross Hook (Rh) forms immediately after price breaks out of point 2 of a 1-2-3 pattern. The hook marks a temporary pullback or consolidation before price continues in the direction of the breakout.
The pattern signals:
A new trend structure
A confirmed shift in market direction
A potential breakout-following opportunity
When the indicator detects this setup, it prints “Rh” on the chart—green for buy signals and red for sell signals.
How to Trade Ross Hooks
To trade the Ross Hook strategy manually, a trader must:
Identify the 1-2-3 pattern
Wait for a breakout above/below point 2
Look for a hook formation
Enter in the direction of the breakout
However, manually identifying 1-2-3 structures across multiple pairs and timeframes is challenging. The Ross Hook Trading Pattern Indicator solves this by automatically detecting:
Point 1, Point 2, and Point 3
Breakout of point 2
Formation of the hook
Bullish or bearish “Rh” signals
This automation allows traders to focus on confluence, risk management, and trade execution instead of searching for patterns.
Understanding the "Rh" Signals
When the indicator identifies a valid hook:
Green “Rh” = bullish breakout confirmation
Red “Rh” = bearish breakout confirmation
These signals appear after the breakout of point 2, meaning they act as Trend Continuation cues rather than early reversal alerts. While the signals are helpful, not every Rh print results in a high-probability trade. The best setups occur when signals align with strong Price Action zones.
How to Trade Using the Ross Hook Indicator (With Price Action)
The indicator performs best when combined with support/resistance, order blocks, and candlestick patterns.
Example Strategy
The chart example (EURUSD, H1) shows the following sequence:
The indicator detects a valid 1-2-3 formation.
A bullish Rh signal appears after the breakout of point 2.
Price simultaneously retests a bullish order block (support zone).
This confluence confirms high buyer interest and increases the probability of a trend continuation.
A long position becomes valid when the Rh signal aligns with the retest.
Using confluence ensures traders avoid low-quality Ross Hook signals that form in weak or choppy market conditions.
Best Settings & Trading Tips
Works on all currency pairs
Performs well on higher timeframes (M30, H1, H4)
Combine with trendlines, order blocks, and volume indicators
Avoid trading Rh signals during low-volume sessions
Wait for a retest near structure before entering
Conclusion
The Ross Hook Trading Pattern Indicator for MT4 is a highly valuable tool for traders who rely on breakout structures and trend continuation signals. By automatically identifying 1-2-3 patterns and marking Ross Hooks with precise “Rh” labels, the indicator simplifies pattern trading and enhances accuracy. Although not every signal should be traded blindly, combining it with price action makes the strategy significantly more effective.
The indicator is completely free to download, making it an excellent addition to any MT4 trader’s toolkit.
For more tools and trading systems, visit IndicatorForest.com.
FAQ
2 Downloads
Published:
Nov 13, 2025 21:23 PM
Category: