Master Volatility and Trend Cycles with the i-Bands Price Indicator for MT4
In the modern financial markets, volatility is the only constant. For traders utilizing MetaTrader 4 (MT4), the challenge lies in distinguishing between a standard price fluctuation and the start of a major trend expansion. The i-Bands Price Indicator is a professional-grade technical solution designed to quantify market "stretch" and volatility cycles. By transforming standard volatility band logic into a responsive oscillator format, this indicator provides traders with a definitive view of when an asset is overextended or ready for a high-velocity breakout.
The Evolution of Volatility Analysis
Traditional Bollinger Bands® are plotted directly on the price chart, which can often lead to visual clutter, especially when combined with other Support And Resistance levels. The i-Bands Price Indicator takes the core mathematical principles of standard deviation and moves them into a dedicated sub-window. This creates a clean, oscillator-style interface that measures the current price position relative to its volatility boundaries.
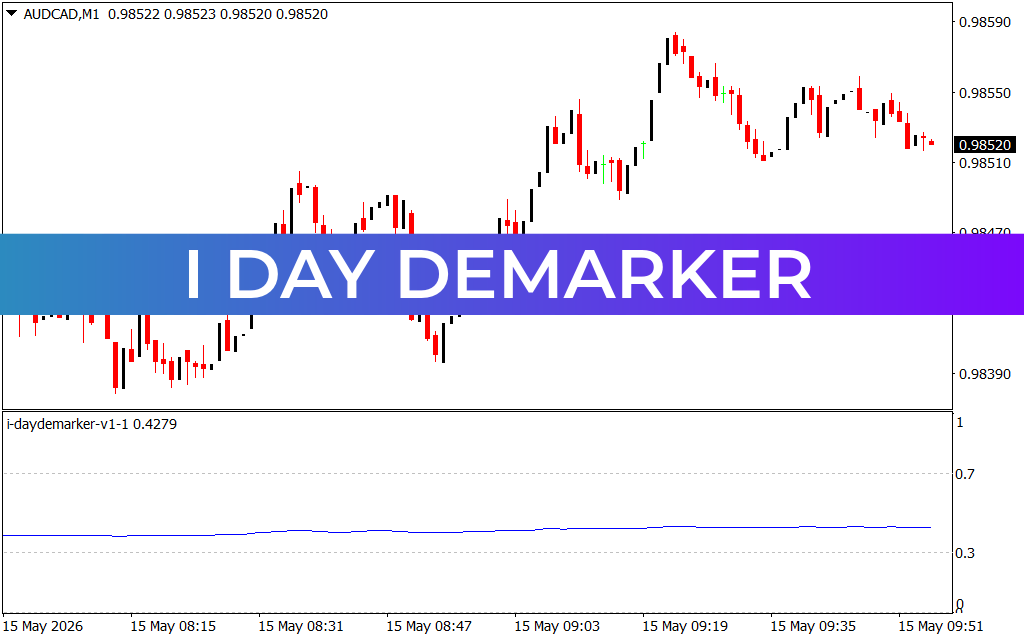
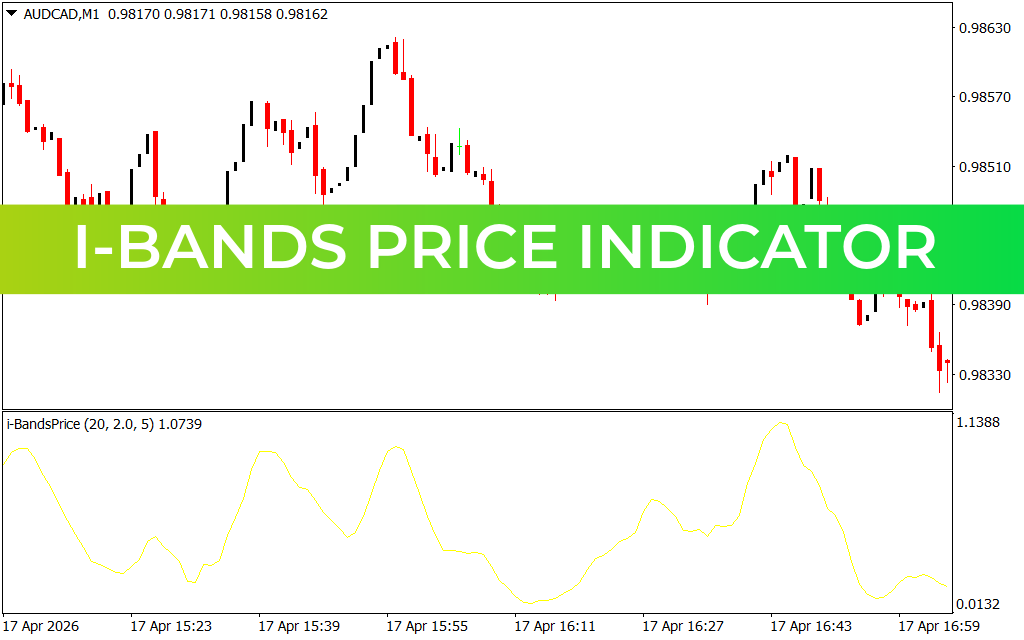
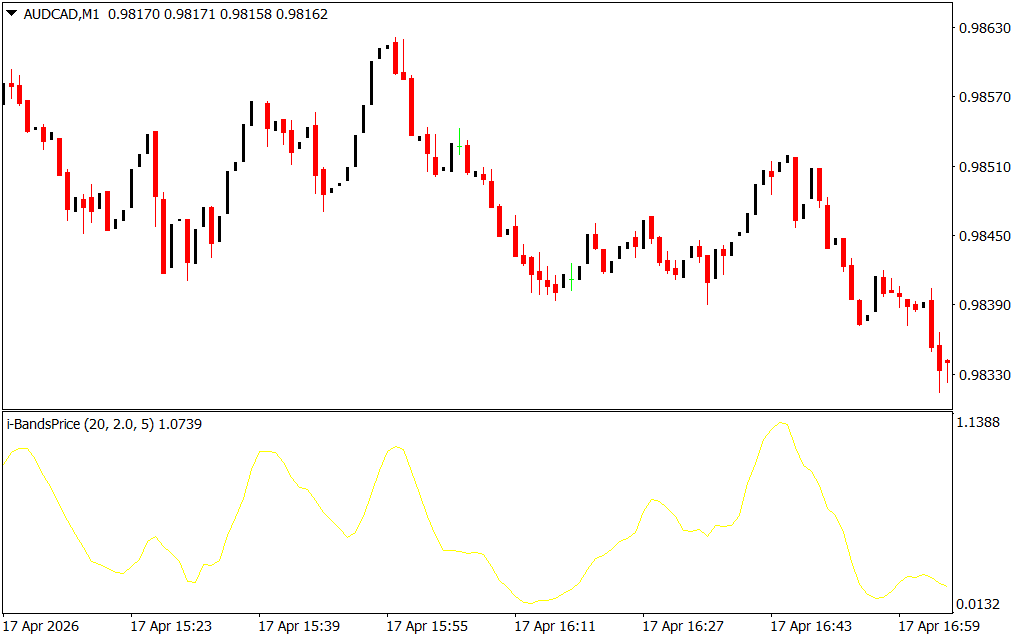
As demonstrated in technical analysis on diverse pairs like AUD/CAD on the M1 timeframe, the i-Bands system provides several definitive operational advantages:
- Identifying Peak Momentum: When the i-Bands line reaches its upper or lower extremes, it signals that Price Action is significantly deviated from its mean. As seen on recent M1 charts, these "peaks" and "troughs" serve as high-conviction markers for potential mean-reversion trades.
- Volatility Squeeze Detection: One of the most powerful features of the i-Bands logic is identifying periods of low volatility. When the oscillator line stays within a narrow range, it indicates a "squeeze." Professional traders use this as a precursor to a massive breakout, ensuring they are positioned before the institutional expansion begins.
- Precise Trend Timing: Unlike standard bands that can "walk" with the price, the i-Bands Price oscillator offers a clearer view of momentum shifts. A sharp turn from an extreme level often precedes a Trend Reversal, providing a surgical exit or entry point.
- Cross-Timeframe Synergy: Whether you are Scalping the M5 for quick gains or analyzing the H1 for intraday swings, the i-Bands Price algorithm maintains its structural integrity, offering a consistent framework for measuring market health.
Strategic Implementation for Systematic Success
The i-Bands Price Indicator is an essential asset for any trader who values a data-driven, objective approach to the markets.
- Mean Reversion Plays: Look for the indicator to reach an extreme overbought or oversold level. When the line begins to curve back toward the center, it signals that the initial impulse is fading, and a move back to "fair value" is likely.
- Breakout Confirmation: During a volatility squeeze, wait for the i-Bands line to aggressively break away from its median. This confirms that the market has found the "energy" required for a sustained directional move.
- Divergence Analysis: Monitor the peaks of the i-Bands oscillator against the actual price peaks. If price makes a new high but the i-Bands fails to reach a new extreme, it indicates a hidden weakness in the trend, signaling an impending correction.
Conclusion
The i-Bands Price Indicator for MT4 is a definitive solution for traders who demand clarity and mathematical precision in their volatility analysis. By bridging the gap between standard deviation logic and oscillator responsiveness, it empowers you to navigate the financial markets with grounded, professional confidence. Elevate your technical analysis today and master the cycles of volatility with the i-Bands Price system.
1 Download
Last Update:
Apr 18, 2026 16:35 PM
Published:
Feb 05, 2026 19:07 PM
Category: