Simplify Your Charts: The Power of the ASC Bars Indicator
In the high-velocity world of day trading, the ability to process information quickly is the ultimate edge. Many traders struggle with "analysis paralysis," where too many complex indicators lead to hesitation and missed opportunities. The ASC Bars Indicator is a premium technical solution designed to eliminate this clutter by streamlining market sentiment directly onto your Price Action through intuitive, color-coded candlesticks.
What is the ASC Bars Indicator?
The ASC Bars Indicator is a trend-following tool that transforms standard Japanese candlesticks into a more meaningful visual representation of market momentum. Unlike basic price charts that simply show open, high, low, and close, the ASC Bars algorithm analyzes volatility and underlying strength to paint the bars based on the dominant market force.
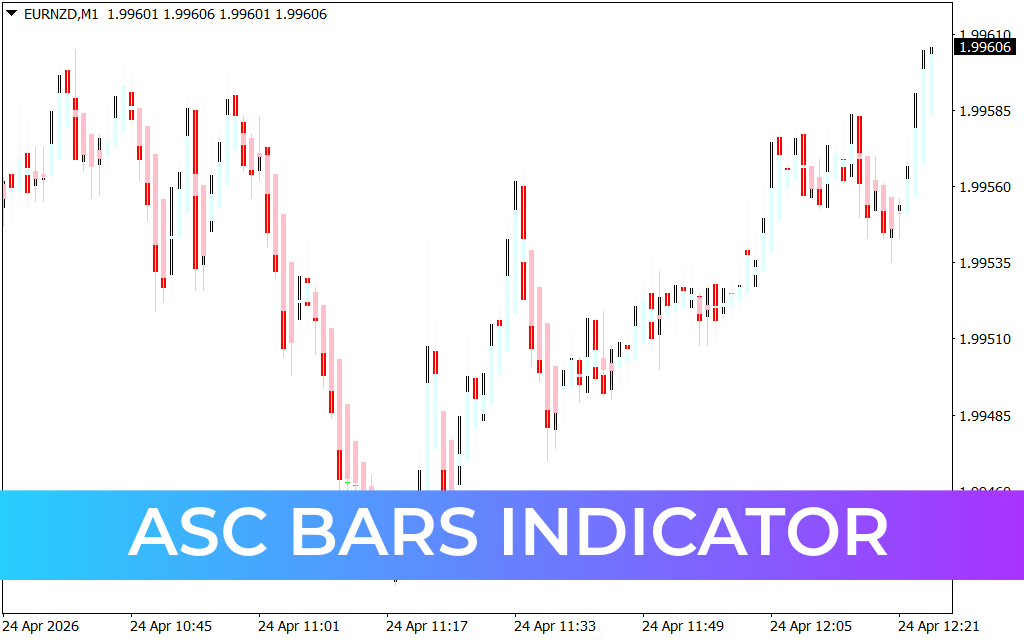
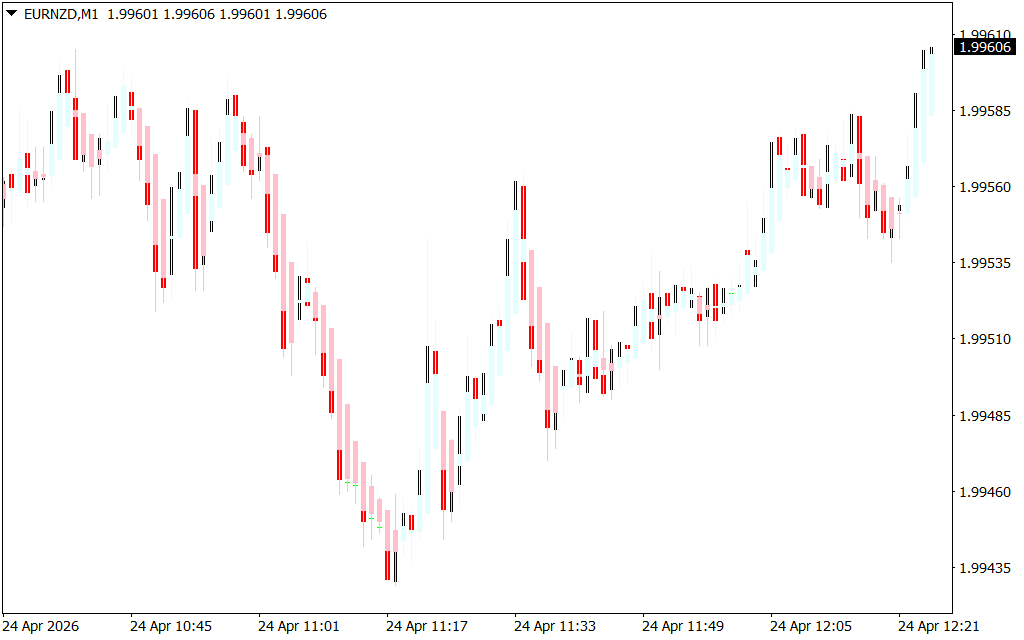
As seen in the EURNZD M1 chart, the indicator replaces traditional candle colors with a distinct logic:
- Cyan/Light Blue Bars: Represent bullish dominance and upward momentum.
- Red Bars: Represent bearish pressure and downward momentum.
- White/Neutral Bars: Often signal periods of consolidation or low-volatility "wait and see" zones.
Why Visual Clarity Wins in Trading
The primary advantage of the ASC Bars system is its ability to filter out market "noise." In a standard chart, a single green candle in a downtrend might trick a novice trader into buying prematurely. However, ASC Bars remains focused on the broader trend; it won't flip to cyan unless the momentum shift is statistically significant.
- Psychological Ease: By simplifying the chart, ASC Bars reduces the emotional stress of trading. You no longer need to second-guess every minor price flicker; you simply follow the color of the trend.
- Trend Persistence: This indicator is exceptional at keeping traders in winning positions. As long as the bars remain a consistent color, the trend is considered healthy, allowing you to maximize profits on extended moves.
- Scalping Precision: For 1-minute traders, ASC Bars provides rapid feedback. The moment a series of red bars transitions into a sharp cyan breakout, it signals a high-probability entry for a momentum scalp.
Strategic Implementation
To get the most out of the ASC Bars Indicator, it is best used in conjunction with Support And Resistance levels. In the provided M1 chart, observe the deep "V" recovery in price action. As the market bottomed out near the 1.99435 level, the ASC Bars flipped from a persistent red streak to a series of strong cyan bars. This color shift served as the primary confirmation that the bearish trend had exhausted and a new bullish cycle had begun.
For risk management, many professional traders use the "color change" as a trailing stop. If you are in a buy trade and the bars turn red, it is an objective signal to exit or tighten your stop loss. Whether you are a beginner looking for a simple way to read the market or a veteran trader needing to clean up a busy template, the ASC Bars Indicator provides the visual discipline required for consistent success.
Meta Description
1 Download
Last Update:
Apr 24, 2026 15:26 PM
Published:
Feb 03, 2026 12:20 PM
Category: