Master Market Momentum with the SVS Oscillator Indicator for MT4
In the fast-paced world of financial trading, identifying the exact moment of a momentum shift is the difference between capturing a trend and being caught in a reversal. Standard oscillators often generate excessive "noise" or lag so significantly that the opportunity has passed before a signal is confirmed. The SVS Oscillator for MetaTrader 4 (MT4) is a professional-grade technical solution engineered to solve these challenges. By utilizing a refined smoothing algorithm, the SVS Oscillator provides a clean, histogram-based visualization of market strength, allowing traders to identify high-probability entries and exits with institutional-grade precision.
The Power of Visualized Sentiment
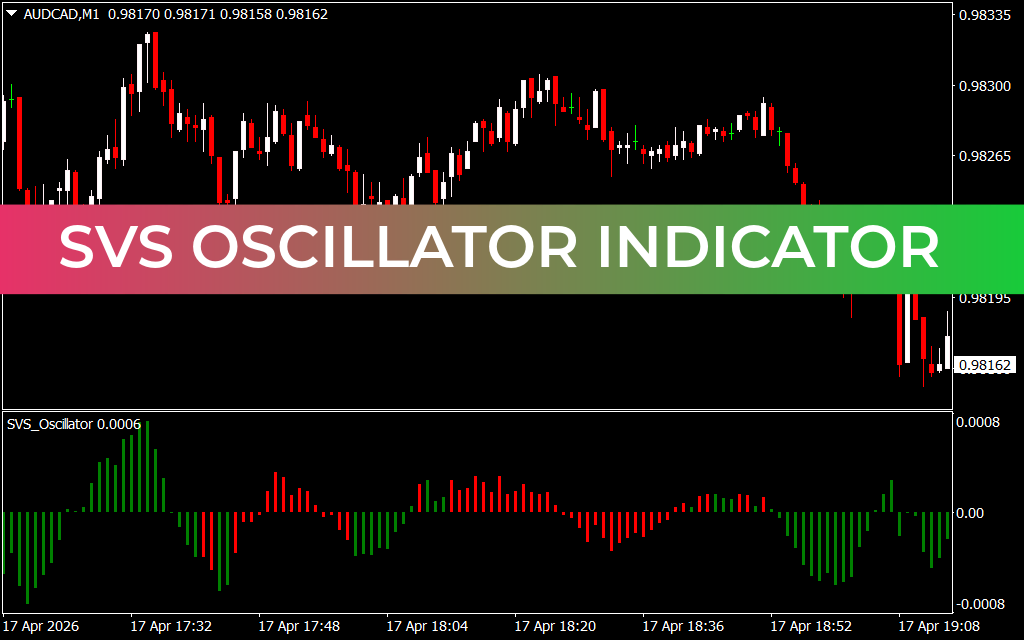
The SVS Oscillator operates as a dual-colored momentum engine. Unlike traditional indicators that rely on single-line crossovers, the SVS uses a responsive histogram to represent the "velocity" of Price Action.
- Bullish Momentum (Green): When the histogram bars are green and rising above the zero-line, it signals that buyers are in total control of the market cycle.
- Bearish Momentum (Red): When the bars turn red and expand below the zero-line, it indicates that institutional sell-side pressure is dominant.
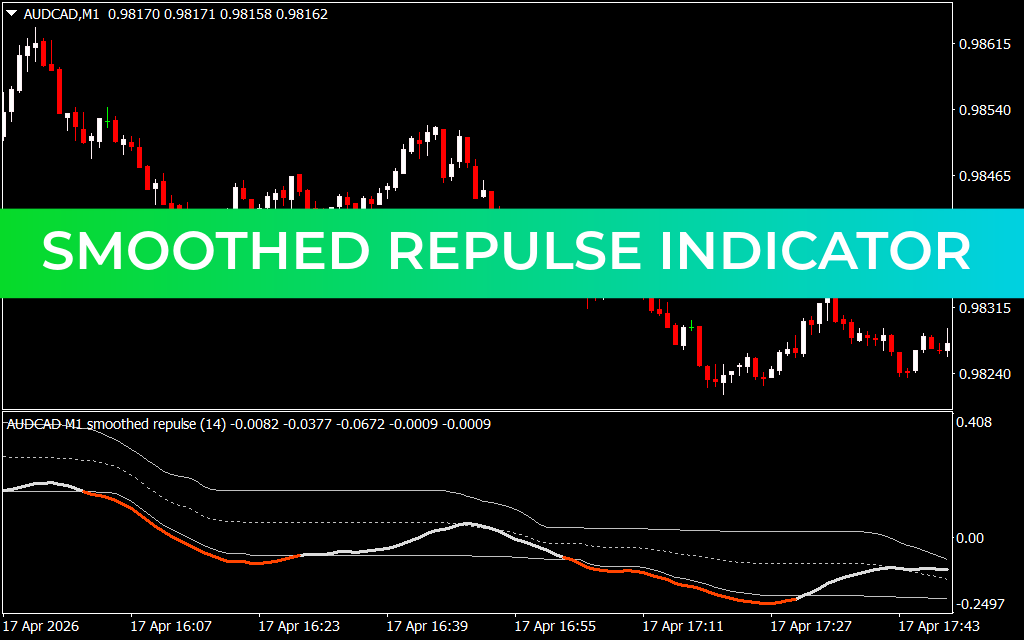
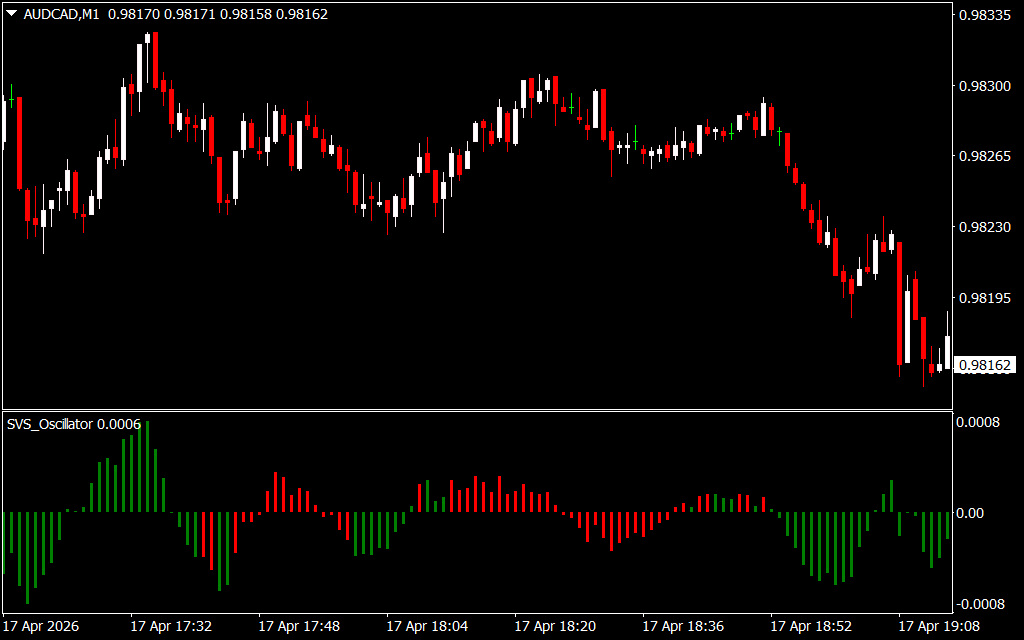
As demonstrated in technical analysis on high-liquidity pairs like AUD/CAD on the M1 timeframe, the SVS system offers several definitive operational advantages:
- Early Detection of Trend Exhaustion: One of the most powerful features of the SVS Oscillator is its ability to spot "rounding" tops and bottoms. As the histogram bars begin to shrink back toward the zero-line while price is still moving, it provides an early warning that the current trend is losing "fuel," allowing traders to scale out before a reversal occurs.
- Zero-Line Reject Strategy: In a trending market, the zero-line acts as a psychological equilibrium point. Professional traders look for the histogram to pull back toward zero and "reject" it by changing color back to the dominant trend. This confirms a high-probability trend-continuation entry.
- Filtering Market Noise: The SVS algorithm is specifically tuned to ignore minor price fluctuations that often trigger false signals in standard oscillators. This results in a "smoother" trading experience, especially on lower timeframes like the M1 or M5.
- Precise Exit Timing: By monitoring the color change of the histogram, traders have an objective, mechanical signal to close positions, removing the emotional guesswork often associated with discretionary trading.
Strategic Implementation for the Systematic Trader
The SVS Oscillator is an essential asset for any trader who values a disciplined, data-driven approach.
- The Momentum Breakout: Enter a trade when the SVS histogram crosses the zero-line with significant volume. A fresh green bar crossing above zero signals a bullish breakout, while a red bar crossing below signals a bearish breakdown.
- Divergence Mastery: Monitor the peaks of the SVS histogram against price action. If price makes a new high but the SVS makes a lower peak, you have a classic bearish divergence—one of the most reliable reversal signals in technical analysis.
- Cross-Timeframe Synergy: For maximum conviction, align the SVS Oscillator across multiple timeframes. A bullish signal on the M15 combined with a fresh zero-line crossover on the M1 creates a top-tier trade setup.
Conclusion
The SVS Oscillator Indicator for MT4 is a definitive solution for traders who demand clarity and mathematical accuracy. By bridging the gap between raw price action and smoothed momentum, it empowers you to navigate the financial markets with grounded, professional confidence. Elevate your technical analysis today and master the rhythm of the market with the SVS system.
1 Download
Last Update:
Apr 18, 2026 16:24 PM
Published:
Feb 05, 2026 22:07 PM
Category: