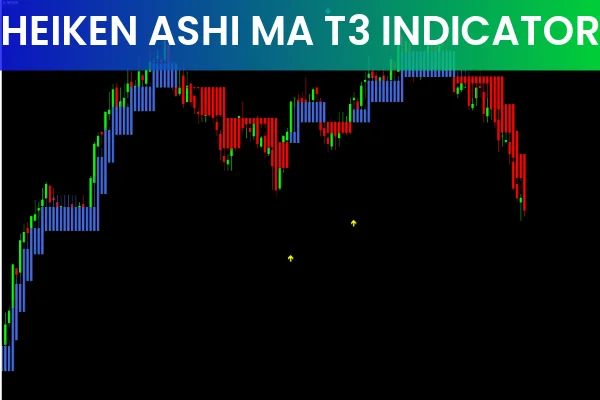
The Heiken Ashi MA T3 Indicator for MT4 is a trend-following trading tool designed to simplify market analysis by overlaying Heiken Ashi–based candles on top of standard candlesticks. Instead of traditional Heiken Ashi colors, the indicator uses blue and red candles that behave like a smoothed moving average, giving traders a clearer view of trend direction and momentum.

In addition to these candles, the indicator also plots trend arrows—yellow arrows for potential uptrends and aqua arrows for potential downtrends. When used together, these two components help forex traders identify Trend Continuation setups and catch early reversals with improved precision.
Because the indicator smooths out short-term noise, it is suitable for traders of all experience levels who want more structured and visually clear signals.
How the Heiken Ashi MA T3 Indicator Works
This indicator combines:
T3 moving average smoothing
Heiken Ashi candle construction
Automatic trend arrows
The T3 smoothing method reduces noise and produces elegantly flowing Heiken Ashi candles.
Here is how the visual components function:
Blue Candles
Indicate bullish momentum
Show that price is closing higher consistently
Suggest continuation during uptrends
Red Candles
Indicate bearish momentum
Show that price is closing lower
Signal downtrend pressure
Trend Arrows
Yellow arrows → Uptrend potential / BUY signal
Aqua arrows → Downtrend potential / SELL signal
These arrows appear frequently, which makes them useful—but also requires filtering using overall market context.
Best Timeframes for the Heiken Ashi MA T3 Indicator
Although the indicator works effectively on all timeframes, the best trading results often come from higher timeframes (H1, H4, Daily). Higher timeframes:
Reduce market noise
Provide stronger, more reliable signals
Help avoid false reversals
Scalpers can still use M15 or M30, but swing and intraday traders will benefit the most from H1 and above.
How to Use the Heiken Ashi MA T3 Indicator (Step-by-Step)
BUY (Long) Setup
A valid BUY setup occurs when:
Heiken Ashi MA T3 candles turn blue, indicating bullish momentum.
A yellow uptrend arrow appears below price.
Price aligns with the overall trend direction.
You can enter long once both conditions appear near the same zone.
For confirmation, check for:
Higher highs and higher lows
Support bounces
Price above 200 MA (optional filter)
Stop-loss:
Below the most recent swing low
Or below the latest red candle cluster
Take-profit:
Previous resistance zone
Or a 1:2–1:3 risk-to-reward ratio
SELL (Short) Setup
A valid SELL setup occurs when:
Heiken Ashi MA T3 candles turn red (bearish momentum).
An aqua downtrend arrow appears above price.
The overall trend supports the short entry.
This combination signals early bearish pressure, providing a clear opportunity to enter a short position.
Stop-loss:
Above the latest swing high
Or above recent blue candles
Take-profit suggestions:
Next support level
Or a 1:2–1:3 R:R ratio
Trading Tips for Better Accuracy
To reduce false signals:
Avoid taking trades against the primary trend
Use arrows only when candle color agrees
Confirm entries using Price Action patterns
Combine with indicators like RSI or MACD for further validation
Since arrows can appear frequently, trend filtering is essential for consistent performance.
Conclusion
The Heiken Ashi MA T3 Indicator for MT4 offers a clean and powerful way to track market momentum using smoothed Heiken Ashi candles paired with automated trend arrows. By combining candle color and arrow direction, traders can easily identify BUY/SELL opportunities with improved clarity.
Because this tool is available for free on our website, you can download it and start testing your trend strategy immediately. It is especially effective on higher timeframes where market noise is minimal, making it an excellent addition to any trader’s MT4 toolkit.
FAQ
4 Downloads
Published:
Nov 19, 2025 03:12 AM
Category: