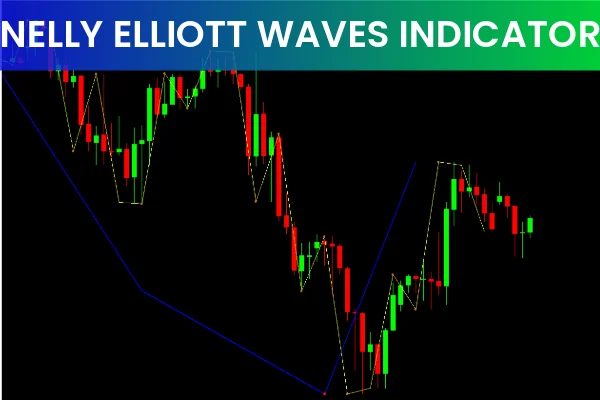
The Nelly Elliott Wave Indicator is a specialized technical analysis tool designed to detect Elliott wave patterns in financial markets. Named after Ralph Nelly, the developer of this indicator, it helps traders identify market momentum by analyzing three main types of waves: impulse waves, corrective waves, and diagonal waves.
Impulse waves move in the direction of the prevailing trend, while corrective waves move against it. Diagonal waves, a subset of corrective waves, move sideways or in a sloping manner. By understanding these patterns, traders can make informed decisions about potential price movements.
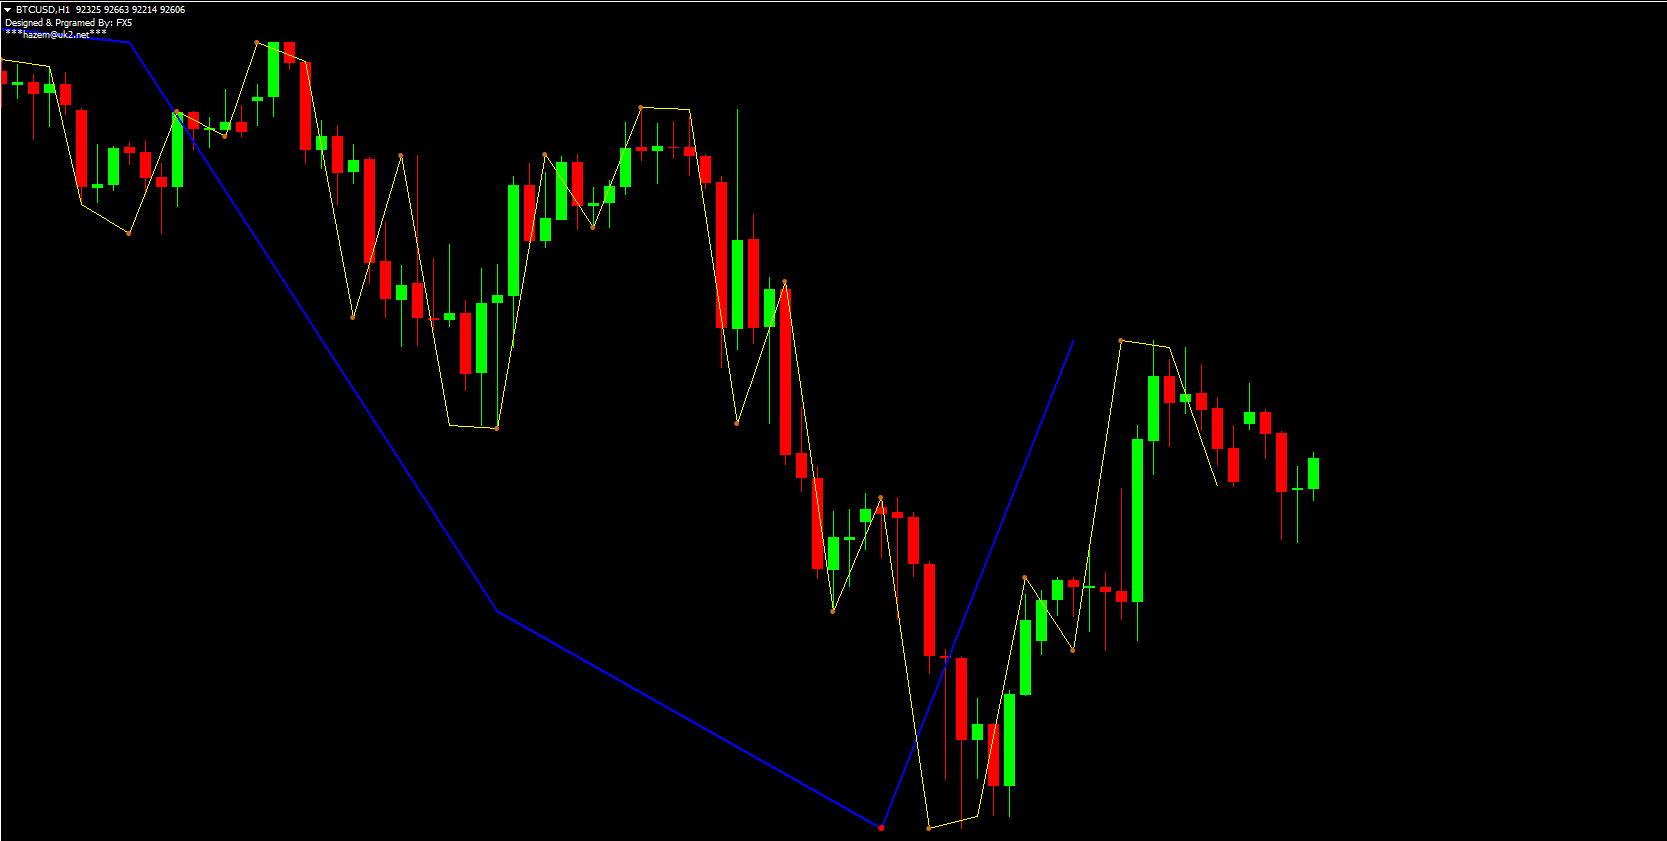
This indicator works on multiple timeframes, making it suitable for both short-term intraday trading and long-term trend analysis. Combining it with other technical indicators increases accuracy in identifying profitable setups.
Types of Waves Detected by Nelly Elliott Wave
Impulse Waves
Impulse waves reflect the main trend direction. They usually consist of five waves, with each wave showing increasing momentum. Traders often look for these waves to identify strong bullish or bearish trends.
Corrective Waves
Corrective waves move against the trend. They are often smaller and indicate temporary retracements in the market. Recognizing corrective waves helps traders avoid entering positions prematurely and manage risk effectively.
Diagonal Waves
Diagonal waves are unique corrective waves that move in a sloped or sideways pattern. They often signal the end of a trend or the beginning of a reversal. Using these waves in conjunction with Support And Resistance levels can improve trade timing.
Nelly Elliott Wave BUY / SELL Signals
Buy Signal
A BUY signal is generated when the indicator detects a sequence of three consecutive waves increasing in size. Typically:
The first wave is small.
The second and third waves expand in size.
This pattern indicates growing market momentum and suggests entering a long position at the start of the next wave. Stop-loss orders should be placed below recent swing lows, while take-profit targets can be set near previous swing highs or resistance levels.
Sell Signal
A SELL signal occurs when the indicator identifies a wider corrective wave than the previous one. This indicates a potential trend shift. Traders can enter short positions at the start of the next downward wave, with stop-loss orders above recent swing highs.
Best Practices for Using the Nelly Elliott Wave Indicator
Combine with Other Technical Tools – Use moving averages, RSI, or MACD to confirm wave signals.
Focus on Higher Timeframes – Daily and weekly charts provide more reliable signals.
Manage Risk – Always use stop-loss and take-profit levels according to wave structures.
Practice Patience – Wait for clear wave patterns before executing trades to avoid false signals.
By following these strategies, traders can maximize the indicator’s potential and improve overall trading performance.
Conclusion
The Nelly Elliott Wave Indicator is a powerful MT4 tool for predicting price trends using wave analysis. It helps traders identify both short-term and long-term market movements, providing accurate buy and sell signals when combined with Price Action analysis.
To start implementing this indicator in your trading strategy, download it for free from IndicatorForest.com and explore additional MT4 tools to enhance your trading efficiency.
FAQ
3 Downloads
Published:
Nov 18, 2025 21:19 PM
Category: