The Heatmap Indicator MT4 is a powerful forex tool designed to help traders analyze and compare the strength of different currency pairs. By displaying data visually through a color-coded system, this indicator allows both beginners and professionals to quickly spot the strongest and weakest currencies in the market. The ability to identify trends—bullish or bearish—makes it an essential component of any trend-trading strategy.
On IndicatorForest.com, traders can find the Heatmap Indicator MT4 and many other useful tools that simplify technical analysis and improve trading performance.
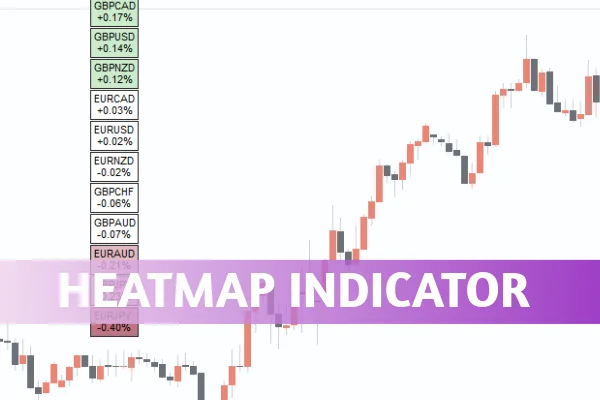
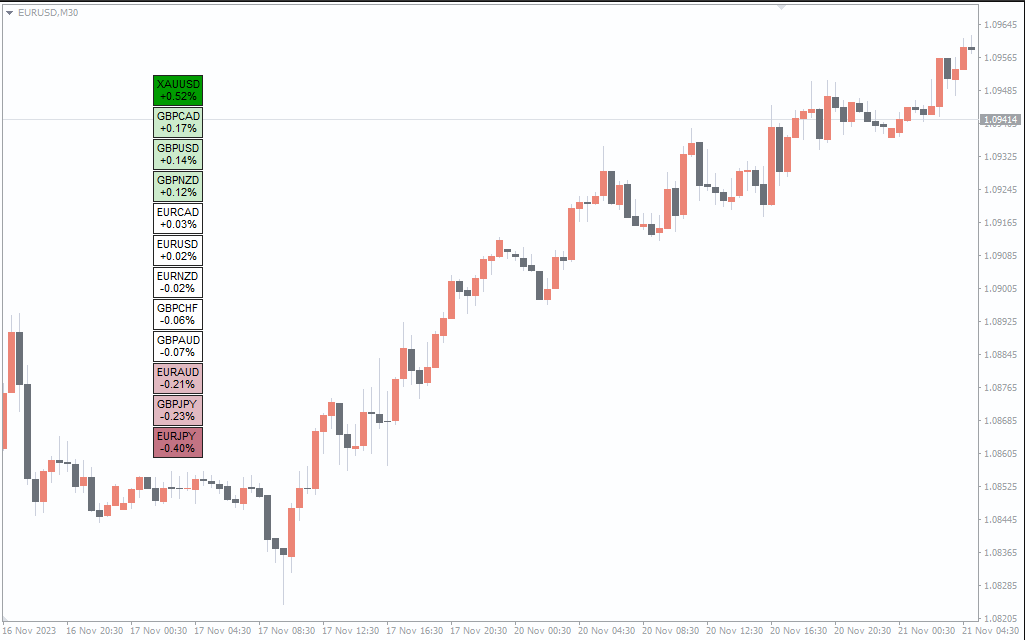
How the Heatmap Indicator MT4 Works
The MT4 Heatmap Indicator provides a visual representation of currency performance by analyzing multiple pairs at once. It uses a simple color-coding scheme to show the strength or weakness of each pair:
Green Box: Strong bullish trend
Light Green Box: Mild uptrend
White Box: Neutral or ranging market
Red Box: Strong bearish trend
Light Red Box: Weak downtrend
This color system enables traders to make quick decisions. For instance, if the EUR/USD is displayed in a dark green box, it indicates strong bullish momentum. On the other hand, if USD/JPY appears in red, it suggests a powerful bearish move.
How to Use the Heatmap Indicator for MT4
Using the Heatmap Indicator MT4 effectively involves combining its signals with other forms of technical analysis, especially Price Action. Here’s how traders can interpret the signals:
Identify Strong Trends:
Focus on the currency pairs showing the strongest green or red boxes. These represent high-probability trading opportunities.
Confirm with Price Action:
Even though the Heatmap displays strength visually, traders should confirm the direction using support/resistance zones, candlestick patterns, or moving averages.
Set Entry and Exit Points:
For bullish pairs (green boxes): Enter buy trades with a stop loss below the previous swing low.
For bearish pairs (red boxes): Enter sell trades with a stop loss above the previous swing high.
Avoid Ranging Markets:
Pairs shown in white boxes indicate sideways movement. It’s best to avoid trading during such periods as the market lacks clear direction.
Benefits of Using the Heatmap Indicator MT4
The Heatmap Indicator MT4 offers several advantages for traders:
Quick Market Overview: Instantly analyze multiple currency pairs without switching charts.
Trend Confirmation: Visual Trend Strength helps validate trading decisions.
Time-Saving Tool: Perfect for scalpers and day traders needing fast data.
User-Friendly Interface: Simple color coding makes it accessible to all experience levels.
By integrating this indicator into your strategy, you can focus on pairs with the most momentum—improving your accuracy and efficiency.
Limitations and Best Practices
While the Heatmap Indicator MT4 is a valuable tool, it should not be used alone. Markets often change due to economic news or volatility spikes, which can affect short-term currency strength. Combine it with other tools like RSI, Moving Averages, or the Force Index Indicator MT4 for stronger trade confirmation.
Always backtest and monitor results to ensure the indicator aligns with your trading style and risk management strategy.
Conclusion
The Heatmap Indicator MT4 is an essential visual aid for forex traders seeking to understand market strength and weakness quickly. By identifying strong bullish and bearish trends, it helps traders make more informed trading decisions. However, for the best results, it should be paired with additional analysis techniques.
Visit IndicatorForest.com to download the Heatmap Indicator MT4 and explore other advanced forex tools to boost your trading performance today.
1 Download
Published:
Oct 31, 2025 14:34 PM
Category: