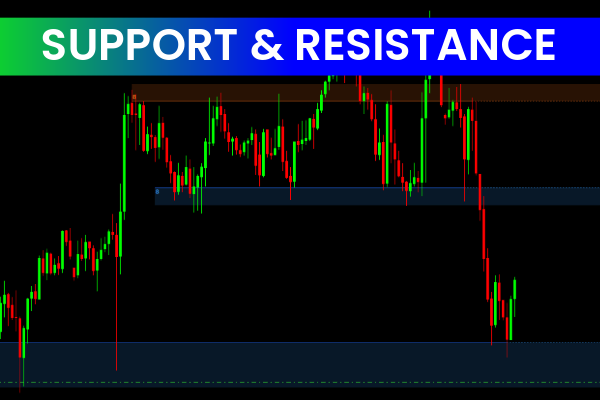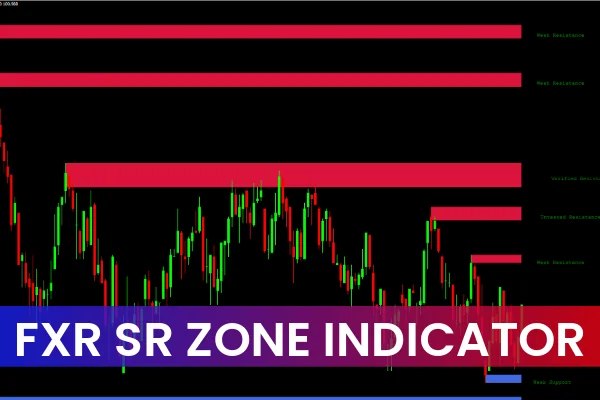
The FXR SR Zones Indicator for MT4 is a powerful Support And Resistance tool that automatically identifies key market zones where price is likely to reverse, stall, or consolidate. Support and resistance levels are core components of technical analysis, and manually plotting them can be time-consuming. This indicator simplifies that process by marking important zones directly on the chart, helping traders make clearer and more confident trading decisions.
FXR SR Zones highlights multiple types of levels—weak, untested, and turncoat zones—giving traders a thorough understanding of Market Structure. It works across all timeframes and suits every trading style, including scalping, intraday, swing trading, and long-term analysis.
FXR SR Zones Trading Signals
The FXR SR Zones Indicator generates BUY and SELL setups based on how the price interacts with its support and resistance zones:
BUY Signals – Support Zone (Blue)
When price approaches or retests a blue support zone, it often indicates:
Potential upward reversal
Increasing buying pressure
A favorable probability for long entries
These support zones are areas where buyers historically stepped in, making them ideal locations to monitor for bullish setups.
SELL Signals – Resistance Zone (Red)
When price approaches a red resistance zone, it signals:
Possible downward reversal
Weakening bullish momentum
A strategic location for short entries
These resistance levels often mark zones where sellers previously dominated.
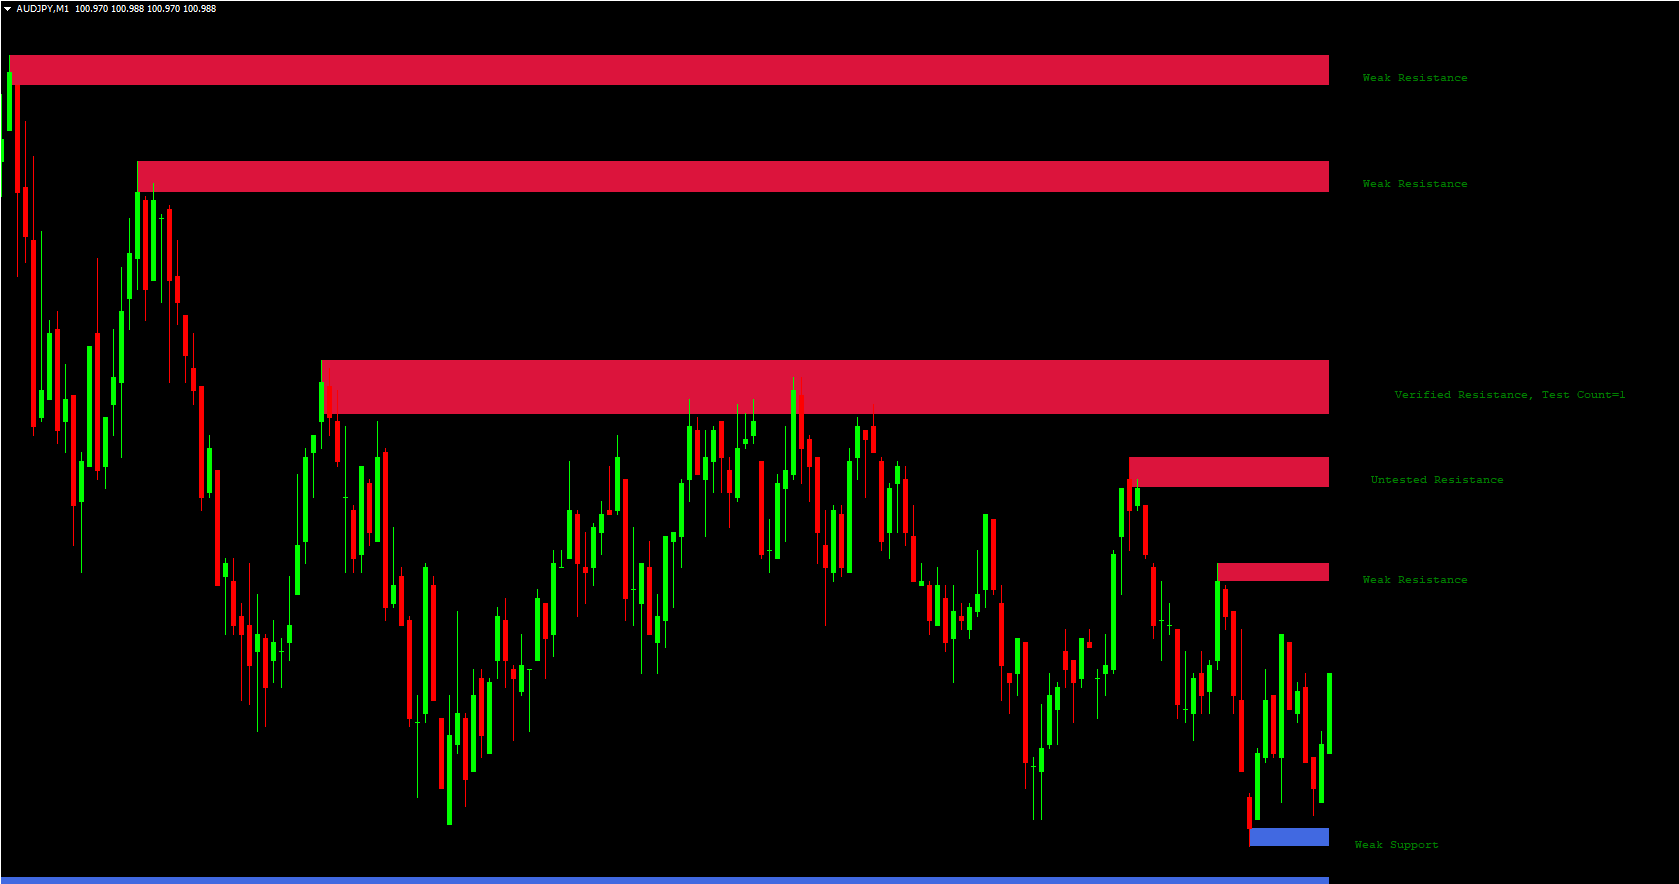
Zone Types Identified by the Indicator
The FXR SR Zones Indicator categorizes levels into three types, giving traders deeper insight into price behavior:
Weak Zones
Areas where price may react
Not yet confirmed by multiple tests
Should be used cautiously
Untested Zones
Fresh levels where price has not interacted yet
High-probability zones for strong reactions
Popular among breakout and reversal traders
Turncoat Zones
Former resistance turned support, or former support turned resistance
Known for strong reactions
Excellent for both reversal and breakout strategies
Turncoat zones are often the most reliable because they show a clear shift in market sentiment.
Risk Management With FXR SR Zones
One of the indicator’s strengths is helping traders position stop-loss levels more effectively.
For BUY trades, stops are typically placed below the support zone.
For SELL trades, stops go above the resistance zone.
This reduces vulnerability to false breakouts and sharp price spikes during volatile sessions.
Conclusion
The FXR SR Zones Indicator for MT4 is an essential support and resistance tool for traders seeking more accurate market structure analysis. By automatically identifying strong, weak, untested, and turncoat zones, the indicator delivers actionable BUY and SELL signals while enhancing risk management. Download the FXR SR Zones Indicator today and elevate your trading strategy with clearer insights and more disciplined trade execution.
FAQ
19 Downloads
Published:
Nov 15, 2025 13:48 PM
Category: