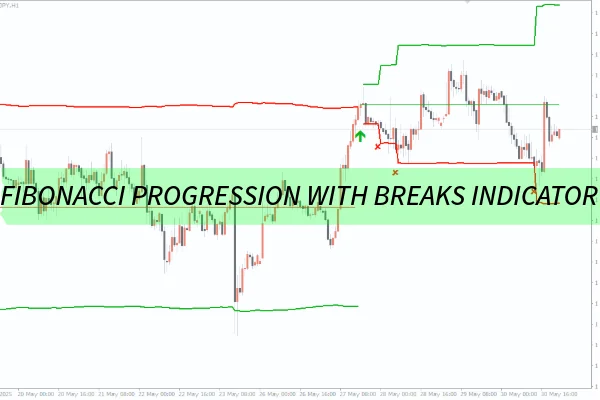
The Fibonacci Progression With Breaks Indicator for MetaTrader 5 is a cutting-edge trading tool developed by LuxAlgo that applies Fibonacci number sequences to market price action. Using a stepwise progression method, it maps out directional levels based on volatility-adjusted Fibonacci distances. When price action breaks through key structures, the indicator marks these areas to help traders recognize new trends or retracements in real time.
This advanced Fibonacci-based system is particularly useful for traders who specialize in Fibonacci theory, trend continuation, and breakout trading strategies. By integrating it into your MT5 platform, you gain access to precise, dynamic price levels that can help refine entries, exits, and overall market interpretation.
The indicator begins by identifying a pivot point — the starting location of a trend move. From this pivot, it projects Fibonacci-based levels outward in a calculated progression (e.g., 1, 2, 3, 5, 8), each adjusted according to market volatility.
When the price moves through these Fibonacci levels, it displays the current stage of the trend. Once price breaks a structural threshold — usually defined by volatility measures such as ATR (Average True Range) — the indicator resets the sequence, signaling a possible trend change or retracement.
This process provides traders with an evolving visual map of market structure, allowing them to:
Identify continuation zones and potential reversal points
Measure price extension with Fibonacci accuracy
Detect trend exhaustion before major pullbacks
Each Fibonacci progression step represents a new phase in market momentum.
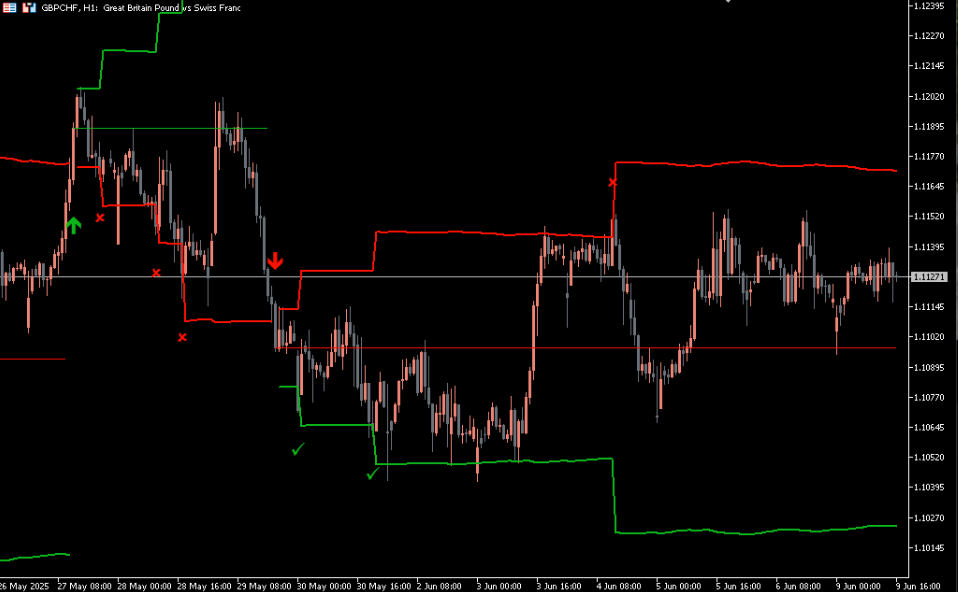
Uptrends: Price rises through Fibonacci-based distance levels (1, 2, 3, etc.) until a breakdown occurs below a volatility-derived baseline.
Downtrends: The same logic applies inversely; prices descend through Fibonacci levels until a structural break signals a shift.
These levels serve as dynamic support and resistance zones, offering valuable targets for profit-taking or position adjustment. Once a break occurs, the count resets, and a new Fibonacci leg begins — a visual representation of evolving market rhythm.
Traders use the Fibonacci Progression With Breaks Indicator in several key strategies:
Breakout Trading: Detects new breakout zones when price exceeds Fibonacci progression levels.
Swing Trading: Identifies retracement limits and continuation levels for swing entries.
Trend Following: Tracks ongoing Fibonacci steps to determine whether the trend remains healthy or overstretched.
The integration of Fibonacci sequences with volatility adjustment makes this tool particularly effective in modern, algorithmic trading environments where speed and precision are vital.
Dynamic Adaptability: Adjusts automatically to changing volatility conditions.
Visual Clarity: Displays progression levels and break markers directly on charts.
Objective Structure Analysis: Replaces guesswork with measurable Fibonacci data.
Enhanced Decision-Making: Clearly defines when to stay in a trade or prepare for a reversal.
Whether you’re an intraday scalper or a long-term swing trader, this indicator helps simplify complex market structures into actionable insights.
The Fibonacci Progression With Breaks Indicator for MetaTrader 5 represents a new generation of Fibonacci-based trading tools. By combining mathematical precision with volatility-sensitive analysis, it enables traders to visualize trend progressions, breakouts, and reversals with remarkable accuracy.
For those who rely on Fibonacci theory, this indicator offers a structured approach to understanding price evolution. Try it today and elevate your trading workflow by integrating this tool into your strategy.
👉 Explore more powerful trading tools and indicators at IndicatorForest.com.
Published:
Oct 12, 2025 10:47 AM
Category: