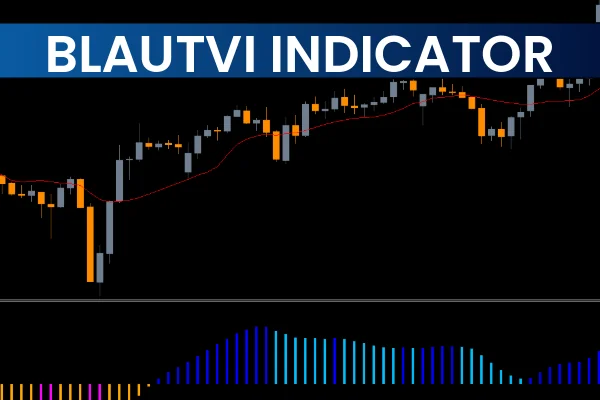
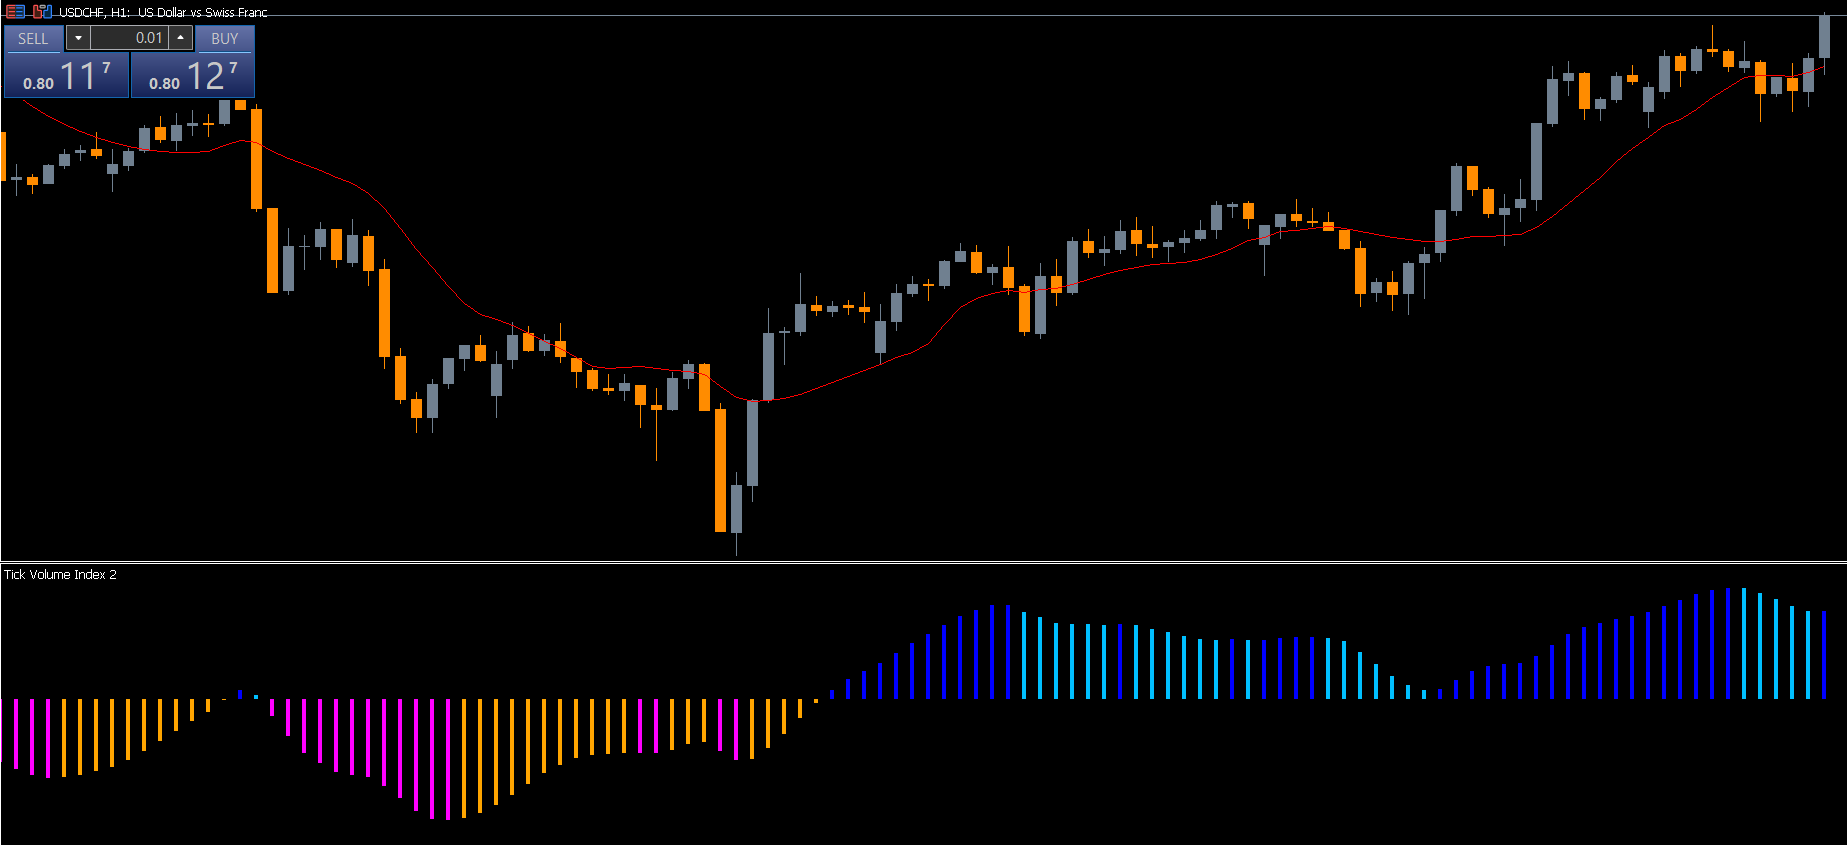
The Blautvi Indicator MT5 is a specialized tool for monitoring tick volume in Forex trading. By visualizing market participation, it allows traders to assess the strength of price movements and identify high-probability entry points. The indicator forms multiple bars on the chart in a wave-like pattern, with distinct colors representing different volume levels. Blue and SkyBlue waves indicate rising or strong tick volume, while Orange and Magenta bars signal low or declining volume.
Using the Blautvi Indicator, traders can better time their entries and exits, focusing on periods where high volume aligns with Price Action. Volume analysis is crucial because it reflects the intensity of buying and selling pressure, which can indicate the continuation or reversal of a trend. For accurate trading signals, this indicator can also be combined with tools such as RSI or MACD to confirm entries.
Understanding the Blautvi Indicator MT5
The Blautvi Indicator plots tick volume directly on your MT5 chart, forming a visual wave pattern. Its color-coded bars help traders instantly recognize market strength:
SkyBlue and Blue bars: Indicate strong bullish volume.
Orange and Magenta bars: Represent weak or declining volume.
These visual cues allow traders to make informed decisions on when to enter long or short positions.
How to Trade the Blautvi Indicator
Buy Strategy
Look for SkyBlue and Blue waves to indicate increasing bullish volume.
Wait for the tick volume to rise along with upward price action.
Enter a buy trade after two or three consecutive upside volume bars.
Place a stop-loss near the recent swing low.
Exit the trade when volume starts decreasing, signaling weakening momentum.
Sell Strategy
Observe Orange and Magenta waves to spot declining or bearish volume.
Wait for volume to fall as the price drops, confirming downward momentum.
Enter a sell trade after two or three consecutive downside bars.
Place a stop-loss above the recent swing high.
Close the trade when volume begins to increase, indicating potential reversal or trend exhaustion.
Timeframe and Market Conditions
The Blautvi Indicator is flexible and can be applied to multiple timeframes. However, it is recommended for charts above 30 minutes, where volume patterns are more reliable and less prone to noise. High-volume markets, such as during London or New York sessions, are ideal for using this indicator.
By applying the Blautvi Indicator in trending markets, traders can catch strong moves early. In consolidating markets, the indicator helps avoid trades when volume is too low, minimizing exposure to false signals.
Advantages of the Blautvi Indicator MT5
Provides a clear visual representation of market volume.
Helps identify high-probability buy and sell zones.
Works well on multiple timeframes, including intraday and swing trading.
Can be combined with other technical indicators like RSI or MACD for confirmation.
Improves trading discipline by filtering out low-volume, high-risk trades.
Conclusion
The Blautvi Indicator MT5 is a valuable tool for any trader seeking to integrate tick volume analysis into their strategy. By visually highlighting bullish and bearish volume waves, the indicator helps determine when to enter or exit trades with confidence. For maximum accuracy, traders should use it on higher timeframes and consider additional confirmation from other indicators.
Download the Blautvi Indicator for free at IndicatorForest.com and enhance your trading strategy with precise volume-based signals.
FAQ
2 Downloads
Published:
Nov 19, 2025 04:42 AM
Category: