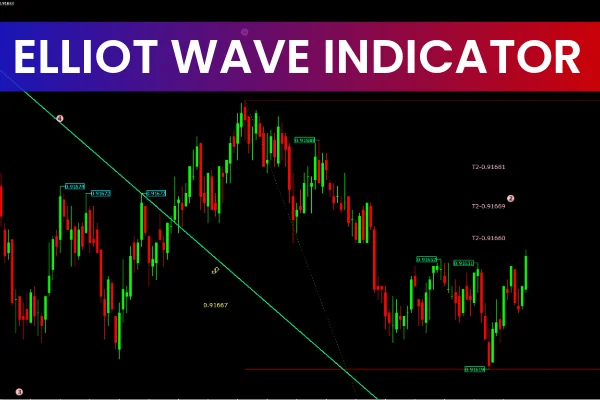
The Elliott Wave Indicator is a powerful technical analysis tool built to identify market cycles and wave structures based on the Elliott Wave Theory. By analyzing Price Action in a structured wave format, this indicator helps traders understand trend direction and anticipate potential reversal points. Whether you're trading forex, stocks, indices, or commodities, the Elliott Wave Indicator enhances market timing and improves trading precision.
How the Elliott Wave Indicator Works
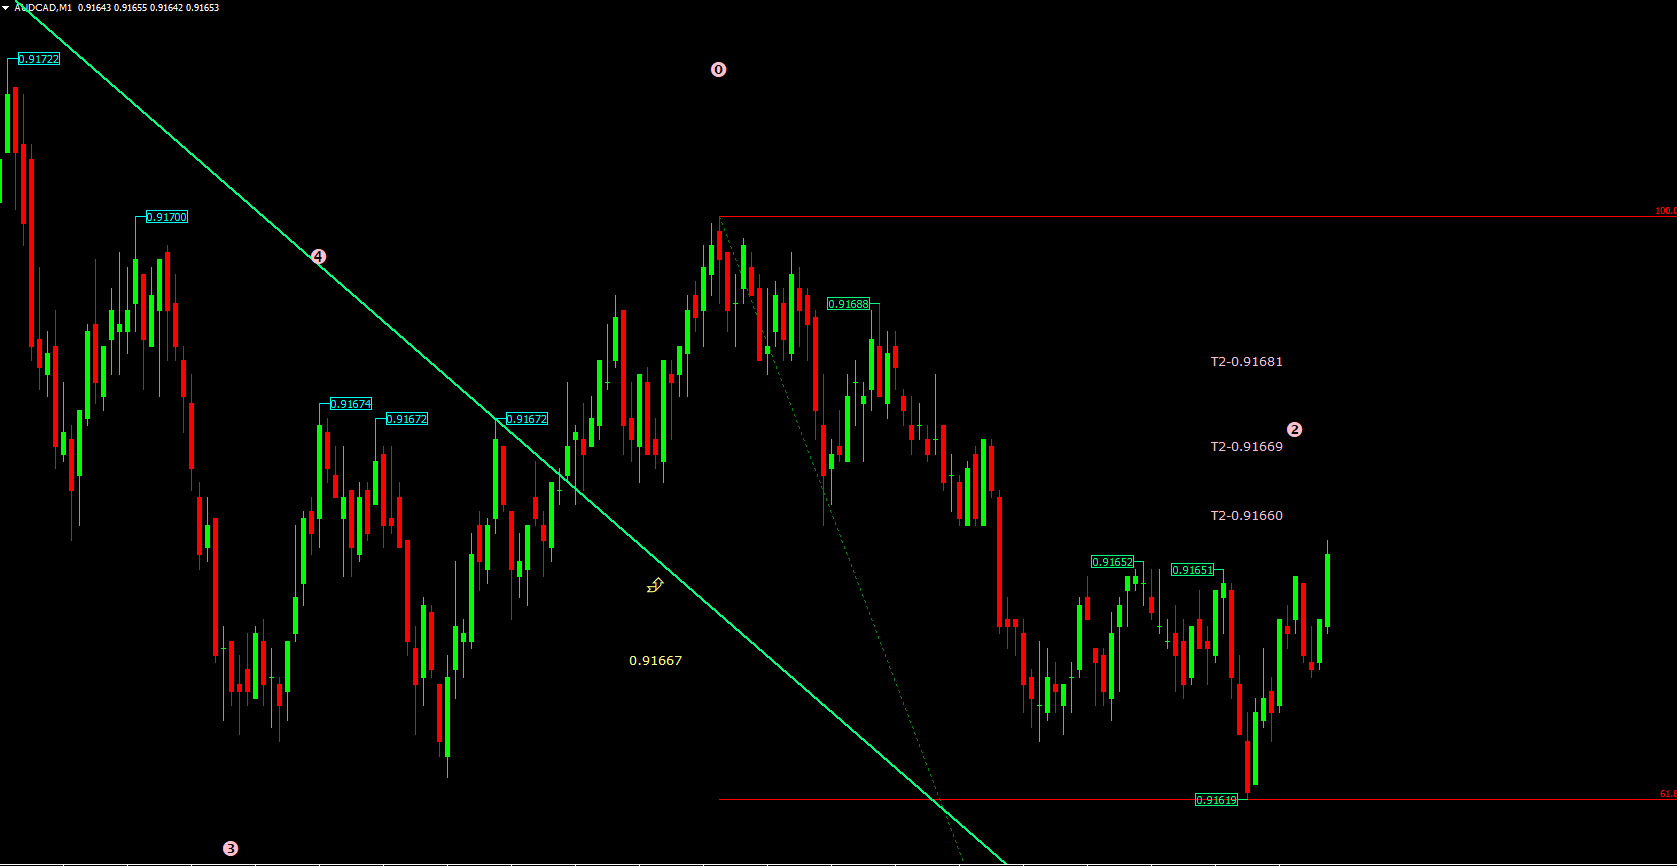
The indicator breaks down price movement into impulse waves and corrective waves, giving traders a visual map of market behavior. Impulse waves typically move in the direction of the main trend, while corrective waves signal pullbacks or temporary reversals. This structure provides the foundation for predicting future price direction and identifying profitable entry and exit levels.
Integration of Fibonacci Levels
Fibonacci ratios are a crucial part of Elliott Wave analysis. This indicator integrates Fibonacci retracements and extensions directly into the wave structure, allowing traders to:
Identify key Support And Resistance levels
Predict potential reversal zones
Validate wave counts with greater accuracy
This combination of wave theory and Fibonacci levels significantly strengthens a trader’s technical analysis.
Elliott Wave Indicator Trading Signals
One of the major benefits of the Elliott Wave Indicator is its ability to label waves automatically in real time. Clear wave labeling helps traders recognize:
Impulse waves: Waves 1, 3, and 5 representing Trend Continuation
Corrective waves: Waves A, B, and C marking pullbacks or consolidation phases
These signals allow traders to anticipate breakouts, reversals, and retracement opportunities with better confidence.
Using Impulse Waves for Trend Trading
When the indicator confirms an impulse wave sequence, traders can align their entries with the prevailing trend. For example:
Wave 3 often signals strong momentum
Wave 5 may indicate the end of the trend and prepare traders for a reversal
Using Corrective Waves for Reversal Setups
Corrective patterns like the ABC structure help traders identify potential retracement zones. During corrective waves:
Traders look for momentum weakening
Fibonacci levels help pinpoint optimal reversal points
Setups become clearer for countertrend trades
Improving Accuracy with Elliott Waves and Fibonacci
Combining Elliott Wave analysis with Fibonacci retracements enhances decision-making significantly. Traders can:
Identify precise entry levels
Set safer stop-loss placements
Project realistic take-profit targets
This fusion of wave logic and mathematical ratios makes the indicator a reliable tool for both novice and advanced traders.
Conclusion
The Elliott Wave Indicator is a must-have tool for traders seeking to understand market cycles, wave patterns, and reversal zones. By automating wave identification and integrating Fibonacci retracements, it simplifies complex wave theory and makes it accessible to all skill levels. With real-time wave labeling and customizable settings, this indicator empowers traders to make more informed and confident decisions.
Explore more premium and free indicators at IndicatorForest.com and elevate your trading strategy today.
FAQ
9 Downloads
Published:
Nov 15, 2025 00:30 AM
Category: