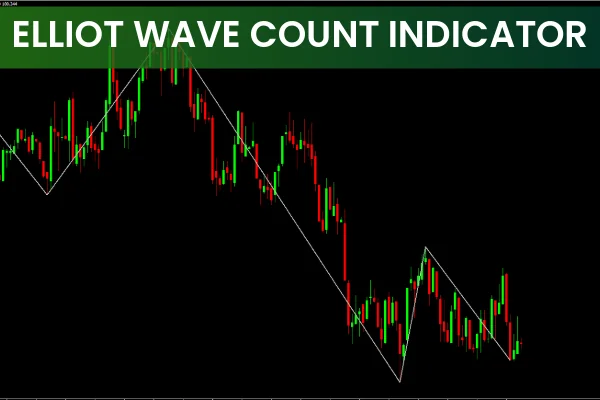
The Elliott Wave Count Indicator for MT4 is one of the most effective tools for traders who use the Elliott Wave Theory to analyze market trends.
It automatically detects and labels Elliott Waves on the chart, making it easier to visualize market cycles and identify trend continuations and reversals.
This indicator is perfect for both beginners and experienced forex traders, as it simplifies the complex process of wave counting. The automatic wave detection helps identify bullish and bearish market phases, enabling traders to pinpoint the best BUY and SELL entry points.
Key Features of the Elliott Wave Count Indicator for MT4
Automatic wave detection and labeling (1, 2, 3, 4, 5 and A, B, C corrections)
Works on all timeframes and currency pairs
Highlights both bullish and bearish wave structures
Fully customizable for visual clarity
Multi-timeframe compatible (MTF) — perfect for top-down analysis
Free to download and easy to install
How the Elliott Wave Count Indicator Works
The Elliott Wave Theory is based on the idea that markets move in repetitive 5-wave patterns in the direction of the trend, followed by 3 corrective waves against it.
The indicator automatically identifies and counts these waves using advanced pattern recognition, giving traders a clear view of:
The direction of the main trend (bullish or bearish)
The position of the current wave within the cycle
The potential reversal or continuation points
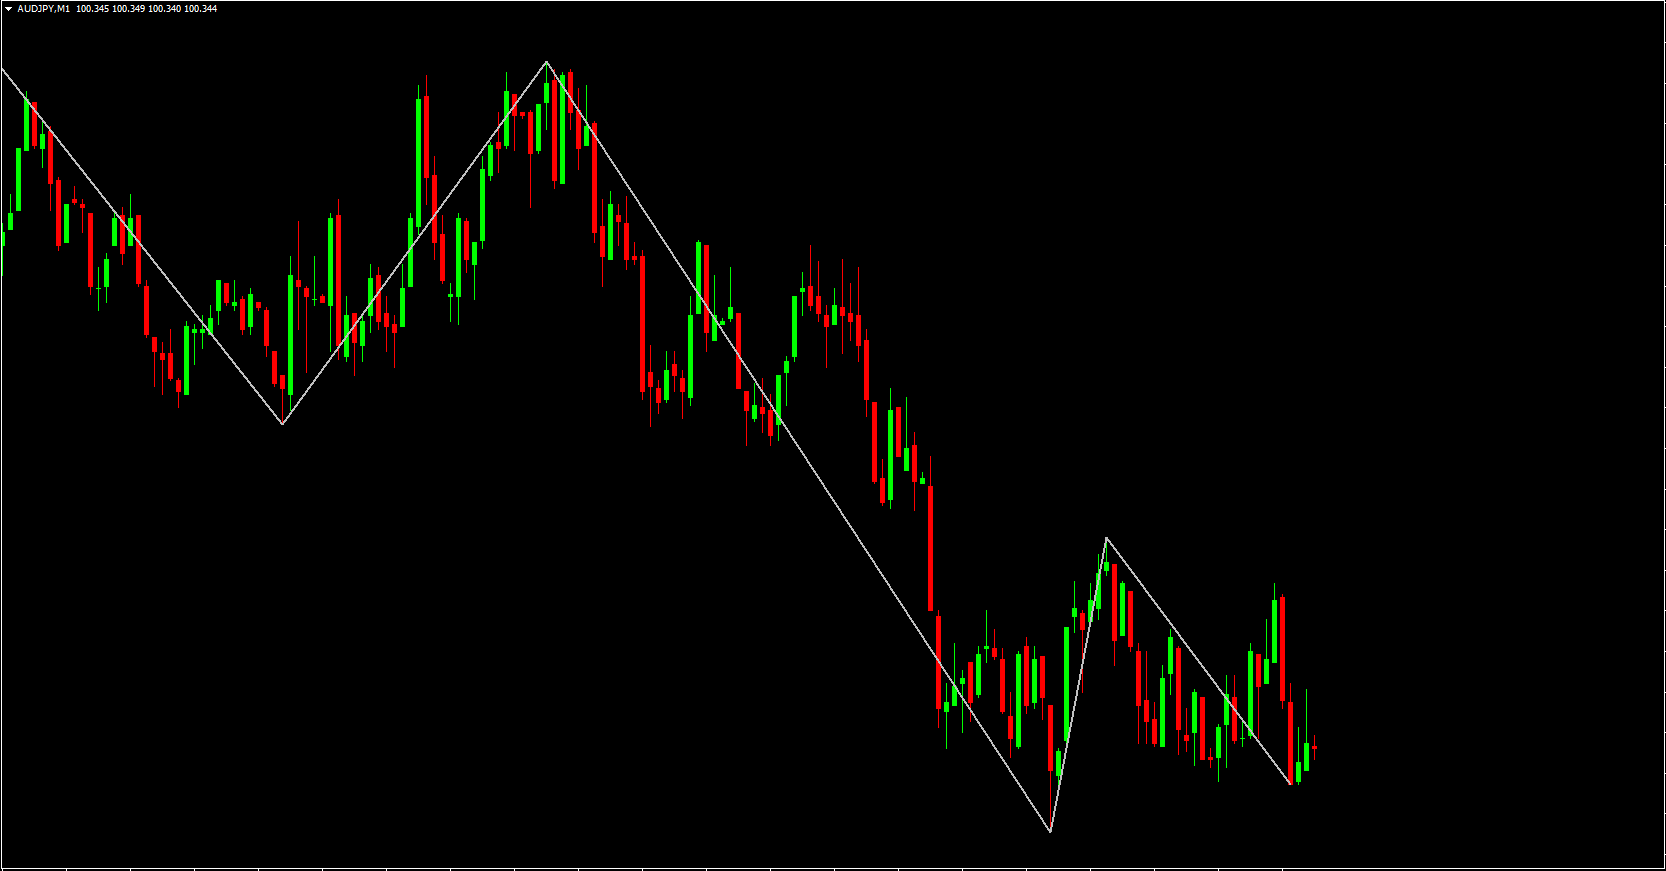
Elliott Wave Count Indicator Trading Setup
The chart below (e.g., EUR/USD H4) demonstrates how to use the Elliott Wave Count Indicator for MT4 effectively.
Bullish Wave Trading Strategy
In a bullish Elliott wave pattern:
Enter a BUY position at the end of Wave 2 (retracement).
Place a Stop Loss just below the swing low of Wave 1.
Set your Take Profit target at the end of Wave 3.
Optionally, trade Wave 5 using the same logic after the Wave 4 pullback.
Tip: The third wave is typically the strongest and most profitable wave in Elliott Wave Theory.
Bearish Wave Trading Strategy
In a bearish wave pattern:
Enter a SELL position at the start of Wave 3 (Trend Continuation).
Set your Stop Loss just above the swing high of Wave 1.
Take profit at the end of Wave 3 or hold until the end of Wave 5.
This approach helps traders avoid counter-trend waves and focus on the strongest parts of the trend.
Support and Resistance Using Elliott Waves
Each wave high and low serves as a key support or resistance level.
Wave 1 high / low often acts as early resistance or support.
Wave 4 retracement tends to be the last pullback before the final wave.
Breakouts above or below these points confirm the trend continuation.
Traders can use these levels to refine entry, stop-loss, and target zones.
Multi-Timeframe Trading with Elliott Waves
The Elliott Wave Count Indicator for MT4 is designed to perform across multiple timeframes.
Because Elliott Waves are fractal in nature, a pattern seen on a higher timeframe (like D1 or H4) can be broken down into smaller wave structures on lower charts (H1, M30, or M15).
This makes it an excellent tool for multi-timeframe (MTF) analysis, where traders identify the dominant higher-timeframe wave and execute entries on lower timeframes for precision timing.
Trading Tips
Always confirm wave beginnings and endings using Price Action or Fibonacci retracement levels.
Focus primarily on trading Wave 3 and Wave 5, as they offer the strongest momentum.
Combine the indicator with trend indicators like Moving Averages or ADX for added confirmation.
Use higher timeframes (H4, D1) for more reliable wave patterns.
Conclusion
The Elliott Wave Count Indicator for MT4 simplifies the complex art of wave counting and helps traders master the Elliott Wave trading strategy.
By automatically plotting the 5-wave and 3-wave structures, it provides clear insight into market direction, strength, and potential reversals.
Whether you’re a beginner looking to understand wave theory or an advanced trader refining your entries, this indicator is a must-have tool for technical analysis.
Download the Elliott Wave Count Indicator for MT4 for free at IndicatorForest.com and start identifying profitable Elliott Wave patterns today.
FAQ
17 Downloads
Published:
Nov 10, 2025 11:43 AM
Category: