The Rahul Mohindar Oscillator (RMO) Indicator for MT5 is a powerful trend-following tool that helps traders identify the main market trend and potential Trend Reversal zones. It was designed by technical analyst Rahul Mohindar to simplify the process of determining trend direction with precision and consistency.
By using a combination of smoothed moving averages and histogram bars, the RMO Indicator provides a clear visual representation of market momentum, making it ideal for both beginner and professional traders.
How the RMO Indicator Works
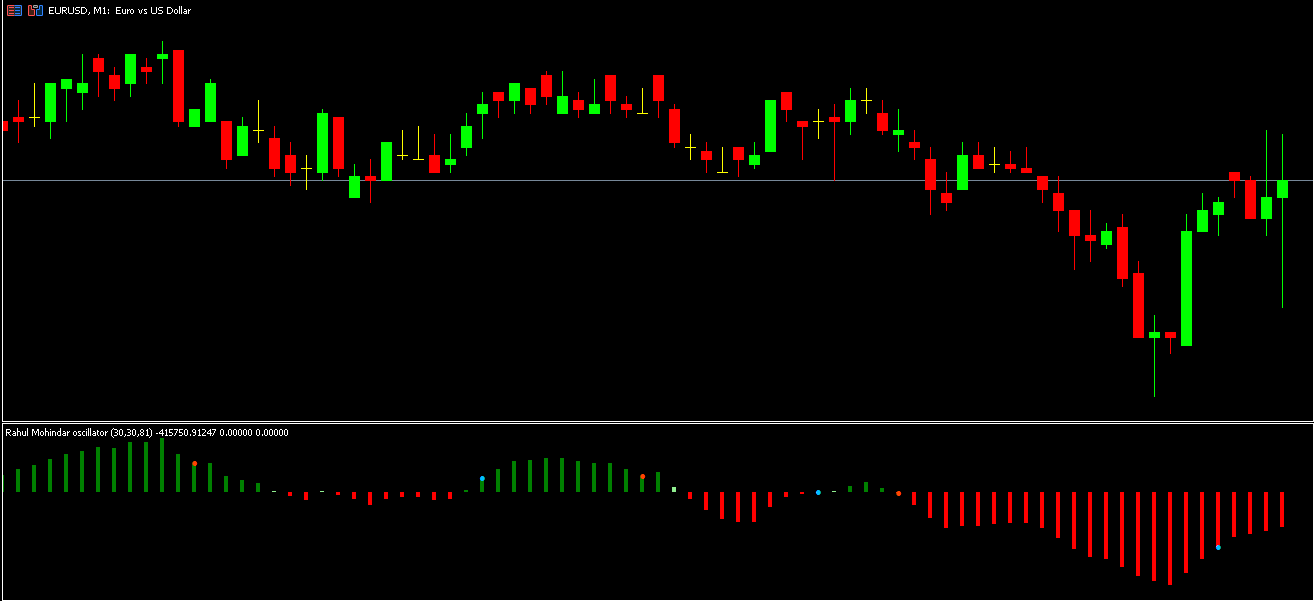
The RMO Indicator operates on the principle of moving average crossovers and histogram-based momentum analysis. It plots:
Histogram bars (RMO): Representing the main market trend and strength.
Signal lines (green and dotted lines): Indicating potential trend reversals when they cross above or below the RMO histogram.
When the signal line crosses above the RMO histogram, it indicates a potential bullish trend. Conversely, when it crosses below the histogram, it suggests a bearish reversal.
The histogram fluctuates between positive and negative zones, divided by a zero level.
Values above zero show bullish momentum.
Values below zero represent bearish conditions.
This structure allows traders to quickly determine whether the market is trending upward or downward at a glance.
How to Trade With the Rahul Mohindar Oscillator (RMO) Indicator
The chart example of the USD/JPY pair on the M30 timeframe demonstrates how the RMO Indicator helps identify trend reversals and trade entry zones.
Buy Signal Setup
The signal dots (blue) appear below the histogram, signaling bullish momentum.
The signal line crosses above the RMO histogram, confirming a potential uptrend.
Price Action retests a demand zone or forms a bullish reversal pattern, validating the entry.
A buy trade can be opened with a stop loss below the nearest swing low.
Sell Signal Setup
The signal dots (red) appear above the histogram, indicating bearish pressure.
The signal line crosses below the RMO histogram, confirming a downtrend.
Price action forms a bearish reversal near a resistance area, confirming a sell setup.
Place a stop loss above the recent swing high.
These conditions help traders combine the indicator’s signals with market structure for more accurate and lower-risk entries.
Best Practices When Using the RMO Indicator
Combine with price action, support/resistance levels, or trendlines for confirmation.
Avoid trading when the histogram hovers around the zero level—this indicates low momentum.
Works best on higher timeframes (M30, H1, H4) to reduce false signals.
Suitable for Scalping, day trading, and swing trading strategies.
Why Choose the Rahul Mohindar Oscillator (RMO) for MT5
Identifies both short-term and long-term trend directions.
Provides clear visual buy/sell alerts with color-coded dots.
Effective for detecting early trend reversals.
Works on all major forex pairs, commodities, and indices.
Free to download and easy to install on MT5.
Conclusion
The Rahul Mohindar Oscillator (RMO) Indicator for MT5 is an excellent trend-following and reversal-detection tool suitable for traders of all levels. Its ability to filter false signals through moving average smoothing and histogram analysis makes it a reliable companion for scalpers, intraday traders, and swing traders alike.
By combining RMO with price action confirmation, traders can gain an edge in identifying strong entry and exit points with higher accuracy. Download the RMO Indicator for MT5 today and enhance your trend-trading strategy!
FAQ
Published:
Nov 09, 2025 04:17 AM
Category: