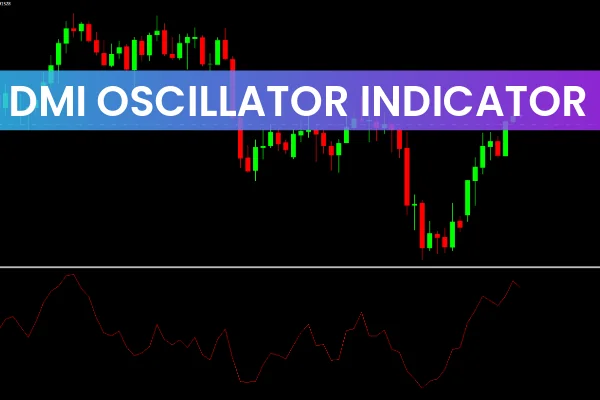
The DMI Oscillator Indicator for MT4 is a powerful technical analysis tool that helps traders identify overbought and oversold conditions in the forex market. Based on the Directional Movement Index (DMI), this indicator not only measures the strength of price movements but also reveals their direction, helping traders make smarter decisions about when to enter or exit trades.
By combining DI+ (positive directional indicator) and DI- (negative directional indicator), the DMI Oscillator produces a dynamic reading that helps traders understand whether a trend is likely to continue or reverse. It’s an excellent addition to any MT4 setup, especially for those seeking clearer, more reliable trade signals.
How the DMI Oscillator Indicator Works
The Directional Movement Index (DMI) is a well-known component of the ADX (Average Directional Index) system. The DMI Oscillator takes the difference between DI+ and DI-, transforming it into a user-friendly oscillator that visually highlights momentum shifts.
DI+ (Positive Directional Indicator) represents upward movement strength.
DI- (Negative Directional Indicator) shows downward movement strength.
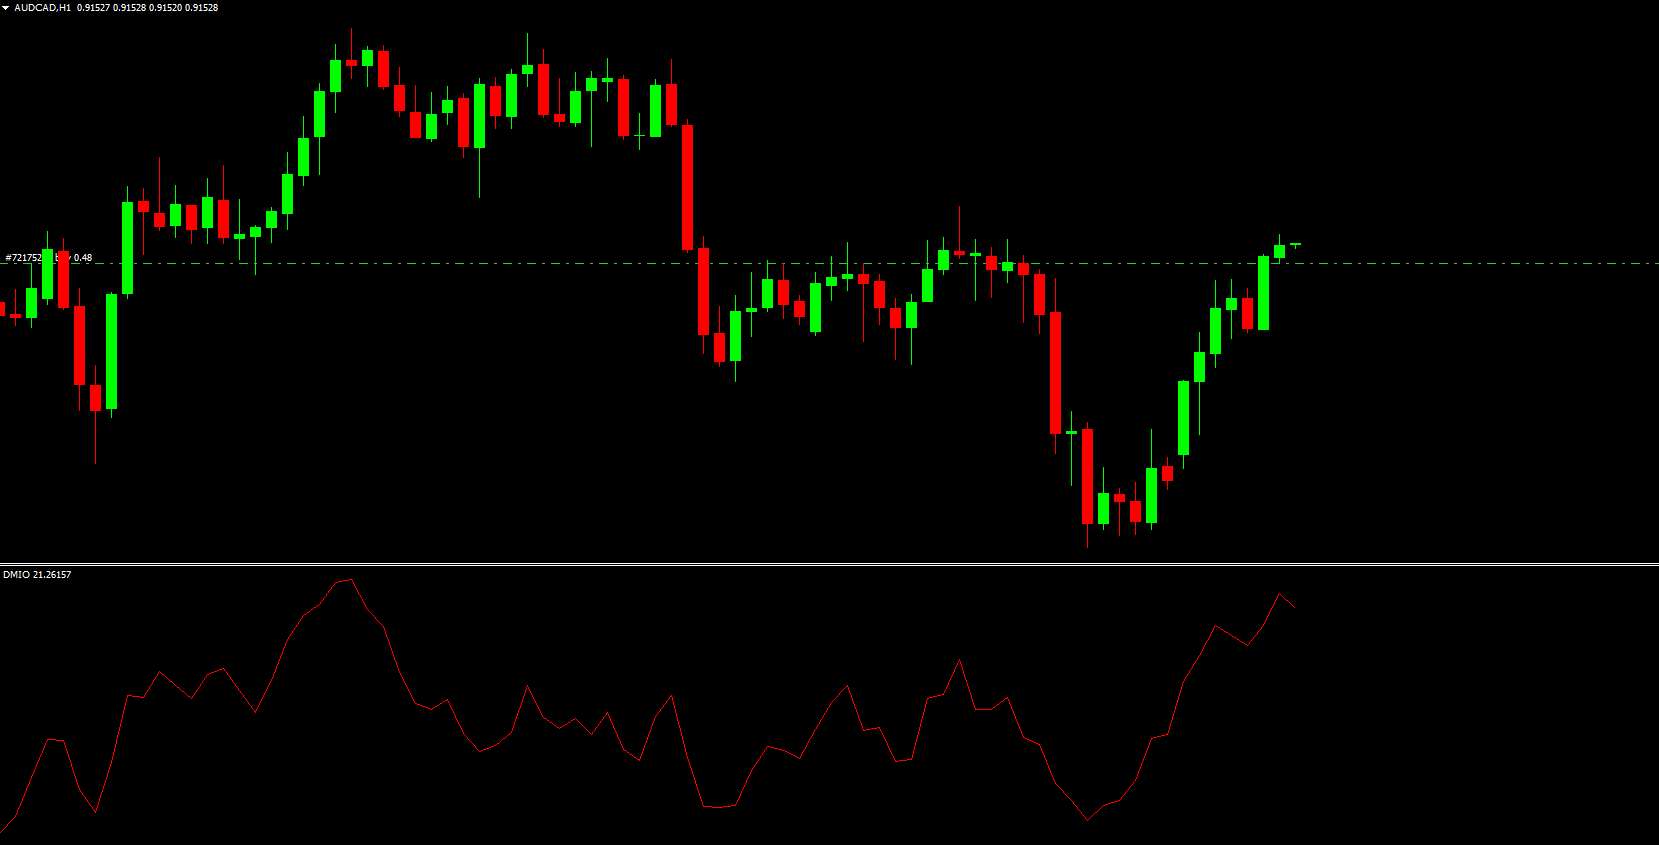
The Oscillator Line (red) fluctuates between positive and negative values to indicate the dominant direction.
When DI+ > DI-, the indicator shows bullish strength. When DI- > DI+, bearish momentum dominates. This makes it easier for traders to identify when to buy, sell, or wait.
DMI Oscillator Indicator BUY/SELL Signals
On the GBP/USD H4 chart, the DMI Oscillator Indicator produces clear BUY and SELL signals based on the position and movement of its signal line.
BUY Signal
When the red signal line drops below the lower zone (oversold region), it indicates a potential buy opportunity.
This means the sellers may be losing control, and a reversal to the upside could occur.
SELL Signal
When the red signal line peaks above the upper region (overbought zone), it suggests a sell signal.
This indicates strong selling momentum and a potential Trend Reversal to the downside.
The indicator also displays red and blue bars for quick visual recognition of momentum changes.
Using the ADX line in conjunction with the DMI Oscillator provides confirmation — higher ADX values indicate stronger trend signals.
Combining the DMI Oscillator with Other Indicators
While the DMI Oscillator Indicator for MT4 performs well on its own, combining it with other technical tools can improve accuracy and reduce false signals. Consider using it with:
Relative Strength Index (RSI) – to confirm overbought/oversold levels.
Bollinger Bands – to detect volatility breakouts.
Moving Averages – to align trades with the overall trend.
Linear Regression Indicator – for advanced trend confirmation.
This combination strengthens signal reliability and gives traders a well-rounded view of market conditions.
Why Use the DMI Oscillator Indicator
The DMI Oscillator Indicator for MT4 offers several advantages for forex traders seeking to improve market timing and decision-making:
Identifies overbought and oversold price zones effectively.
Reduces false alarms by analyzing directional strength.
Provides clear visual BUY/SELL signal cues.
Works across multiple timeframes and currency pairs.
Enhances performance when combined with other oscillators and trend tools.
Free to download from IndicatorForest.com.
Whether you’re a beginner or an experienced trader, the DMI Oscillator helps you read market momentum more accurately.
Conclusion
The DMI Oscillator Indicator for MT4 is a reliable and easy-to-use tool that helps traders identify Trend Strength, direction, and turning points. By using the difference between DI+ and DI-, it provides accurate BUY and SELL signals, especially when combined with ADX for confirmation.
If you want to take your technical analysis to the next level, download the DMI Oscillator Indicator today from IndicatorForest.com and start making better trading decisions.
FAQ
1 Download
Published:
Nov 10, 2025 01:05 AM
Category: