The Fractal Dimension Indicator for MT4 is a powerful volatility analysis tool designed for forex traders. It helps determine whether the market is in a trending or ranging (volatile) state. By interpreting this data, traders can adapt their strategies—entering trades during trends and avoiding whipsaws in choppy conditions.

This indicator is especially useful for both beginner and experienced forex traders who want to optimize entries and exits based on market volatility. At IndicatorForest.com, we provide accurate and reliable indicators like this to help traders make better data-driven decisions.
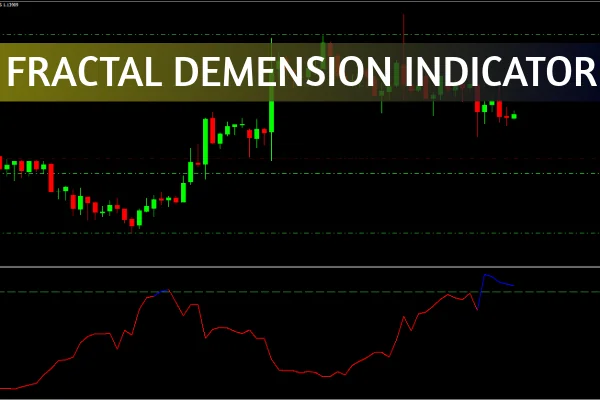
The Fractal Dimension Indicator for MT4 displays a green dotted baseline at the 1.5 level in a separate indicator window. The market condition is interpreted as follows:
Above 1.5: Indicates a volatile or ranging market (avoid trend-following trades).
Below 1.5: Suggests a trending market, ideal for breakout and trend continuation strategies.
The indicator visually reinforces this with color changes:
Red line: Market is trending.
Blue line: Market is ranging or consolidating.
These visual cues make it simple for traders to spot potential transitions between volatility and trending phases.
Installing and using the Fractal Dimension Indicator for MT4 is straightforward. Once applied, traders can observe the indicator’s line fluctuating around the 1.5 mark.
Here’s how to use it effectively:
Monitor the indicator line:
When it stays blue and above 1.5, avoid trend trades—price action is choppy.
When it turns red and dips below 1.5, expect a new trend to begin.
The Fractal Dimension Indicator does not generate direct buy or sell signals. Instead, it’s best used in confluence with other MT4 tools such as:
Moving Averages (to confirm trend direction)
RSI or MACD (for momentum confirmation)
Support and Resistance zones (for precise entry points)
Although it works across all chart time frames, traders achieve more reliable results using it on H4, Daily, or Weekly charts. These longer time frames help filter out noise and false signals common in shorter-term charts.
Suppose the Fractal Dimension Indicator remains blue above 1.5 for an extended period. This suggests a ranging market, where price lacks clear direction. Once the line turns red and drops below 1.5, traders can prepare for a potential trend breakout.
This transition phase is often a signal to shift strategy from range-trading to trend-following, improving overall trading accuracy.
Identifies market volatility instantly
Prevents false entries in unpredictable conditions
Adapts to all forex pairs and time frames
Easy visual interpretation for quick decision-making
Enhances accuracy when combined with other tools
At IndicatorForest.com, we offer this and many other MT4 indicators to help traders analyze markets effectively.
The Fractal Dimension Indicator for MT4 is a simple yet powerful analytical tool for identifying when markets are volatile or trending. By incorporating this indicator into your strategy, you can avoid low-probability trades and focus on opportunities aligned with market momentum.
Whether you’re a new trader learning to avoid market traps or an advanced trader fine-tuning entry strategies, the Fractal Dimension Indicator can help you trade with greater confidence.
👉 Download the Fractal Dimension Indicator for MT4 today at IndicatorForest.com and improve your forex trading results!
Published:
Oct 30, 2025 05:43 AM
Category: