The MA Trend Indicator is a versatile tool that simplifies multi-timeframe trend analysis using moving averages. Moving averages (MA) are classical statistical tools widely applied by technical analysts to evaluate trends in forex, stocks, and other markets. However, traders often struggle to monitor multiple timeframes simultaneously, which can be time-consuming and mentally taxing.
The MA Trend Indicator solves this problem by consolidating all relevant moving averages, periods, and trend directions into a single indicator window. This allows traders to instantly identify both long-term and short-term trends and measure Trend Strength without constantly switching between charts.
How the MA Trend Indicator Works
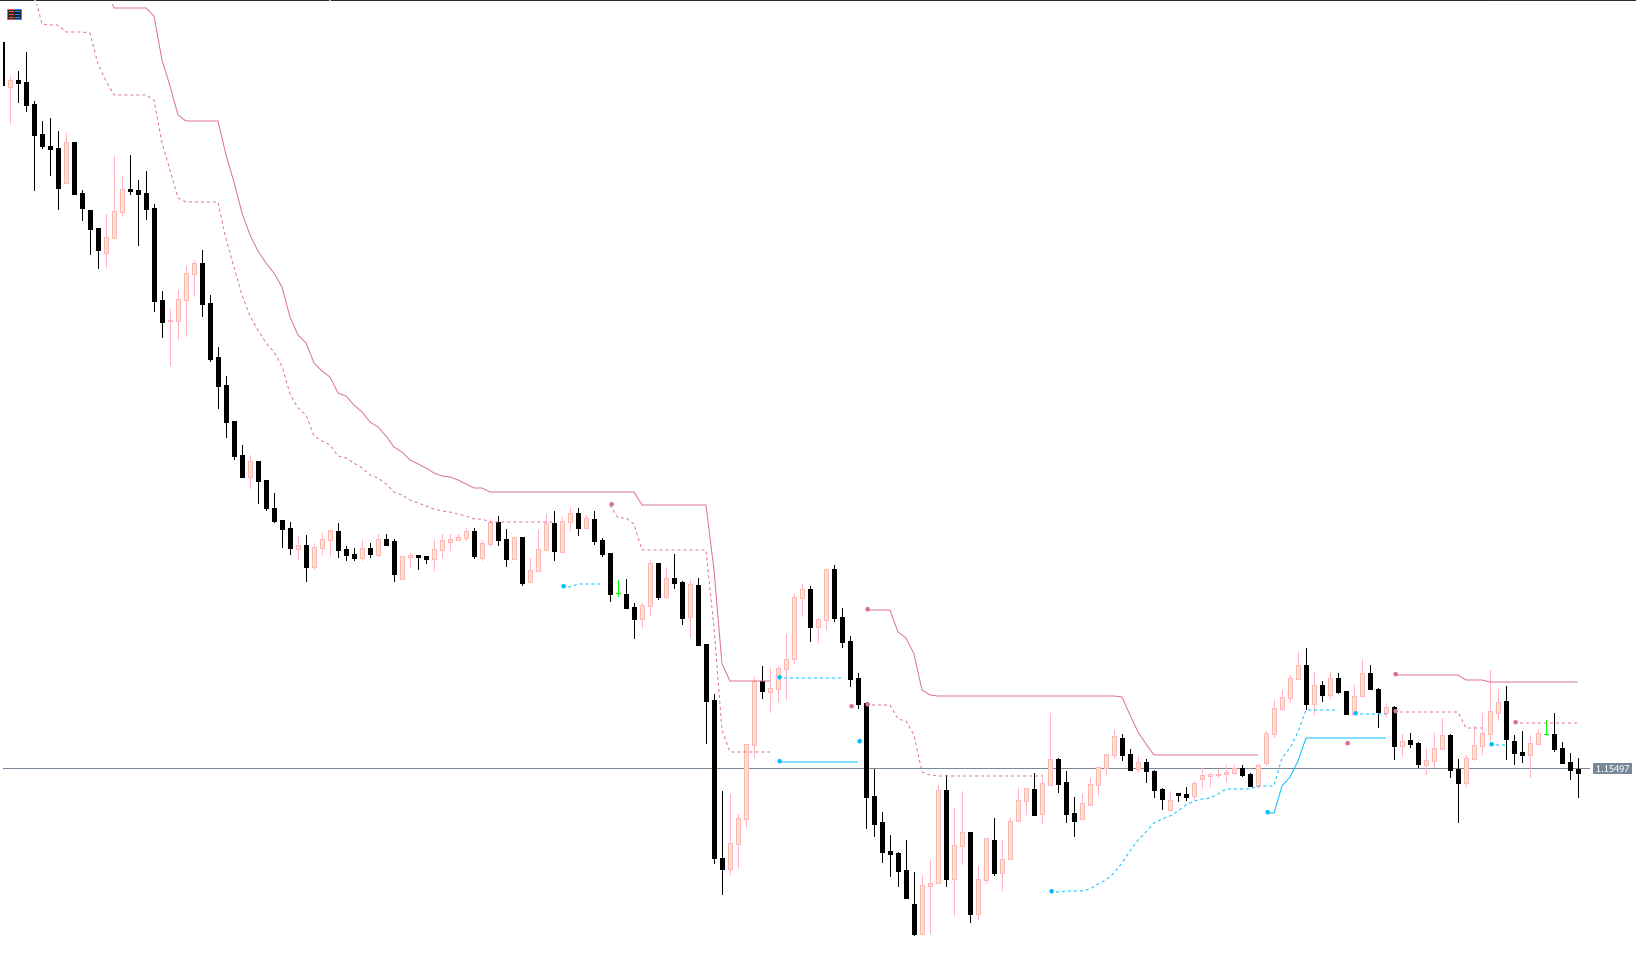
The indicator displays the position of price relative to moving averages across multiple timeframes:
Blue arrow: Price above the moving average, indicating bullish trend
Red arrow: Price below the moving average, indicating bearish trend
Neutral/empty arrow: Consolidation or indecisive trend
For example, on the NZDUSD chart:
The price is above the 35-period moving average in all timeframes except M5 and M15, while M1 is neutral.
All blue arrows signal a strong uptrend.
All red arrows indicate a strong downtrend.
Mixed arrows suggest consolidation or sideways movement.
Traders can adjust the MA periods in the settings, either keeping the same period across all timeframes or customizing each timeframe according to their strategy.
MA Trend Indicator Trading Strategy
Buying Strategy
Set the MA period to 20 for all timeframes.
Look for a situation where all arrows are blue, signaling a strong uptrend.
Confirm with candlestick analysis: Wait for a bullish candle to complete on the 30-minute chart.
Place a buy order at market price.
Set the stop-loss around the recent swing low.
Set the take-profit near the next horizontal support/resistance level or a psychological round number.
Selling Strategy
Set the MA period to 20 for all timeframes.
Look for all red arrows, indicating a strong downtrend.
Confirm with candlestick analysis: Wait for a bearish candle to complete on the 30-minute chart.
Place a sell order at market price.
Set the stop-loss around the recent swing high.
Set the take-profit near the next horizontal support/resistance level or a round number.
Advantages of the MA Trend Indicator
Saves time by displaying multi-timeframe trend directions in one window
Identifies trend strength and direction at a glance
Visual arrows reduce confusion for traders monitoring multiple charts
Adjustable periods to suit short-term or long-term strategies
Works across MT4 and MT5 platforms
Important Notes
While the MA Trend Indicator is highly effective in identifying trends, it is not recommended as a standalone tool. Traders should combine it with other technical analysis methods such as:
Support And Resistance levels
Candlestick patterns
Momentum indicators (RSI, MACD)
Volume-based analysis
Combining tools increases accuracy and helps filter out false signals.
Conclusion
The MA Trend Indicator for MT4/MT5 is an essential tool for traders who perform multi-timeframe analysis. It simplifies trend detection by consolidating moving average information into one window, saving both time and effort. By using the MA Trend Indicator alongside other technical tools, traders can improve their probability of successful entries and exits while staying aligned with both short-term and long-term market trends.
Visit IndicatorForest.com to download the MA Trend Indicator and enhance your trading strategies today.
FAQ
Published:
Nov 28, 2025 10:51 AM
Category: