Mastering Market Correlations with the Corr Ln Delta Smth Indicator
In the sophisticated world of technical analysis, traders are constantly seeking ways to identify the "hidden" relationships between Price Action and underlying market sentiment. Traditional oscillators often focus solely on price speed or overbought/oversold conditions, frequently missing the subtle shifts in trend conviction. The Corr Ln Delta Smth Indicator (Correlation Linear Delta Smoothed) is a high-level technical tool designed to quantify market harmony by analyzing the smoothed correlation of price changes over a specific lookback period.
The Mathematics of Correlation Delta
The Corr Ln Delta Smth Indicator is built on the principle of linear regression and statistical correlation. Instead of looking at raw price data, it examines the "Delta"—the change in price—and applies a logarithmic smoothing function to the correlation coefficient. This process effectively strips away the "random walk" noise inherent in financial markets, leaving behind a clear signal that represents the strength and consistency of a trend.
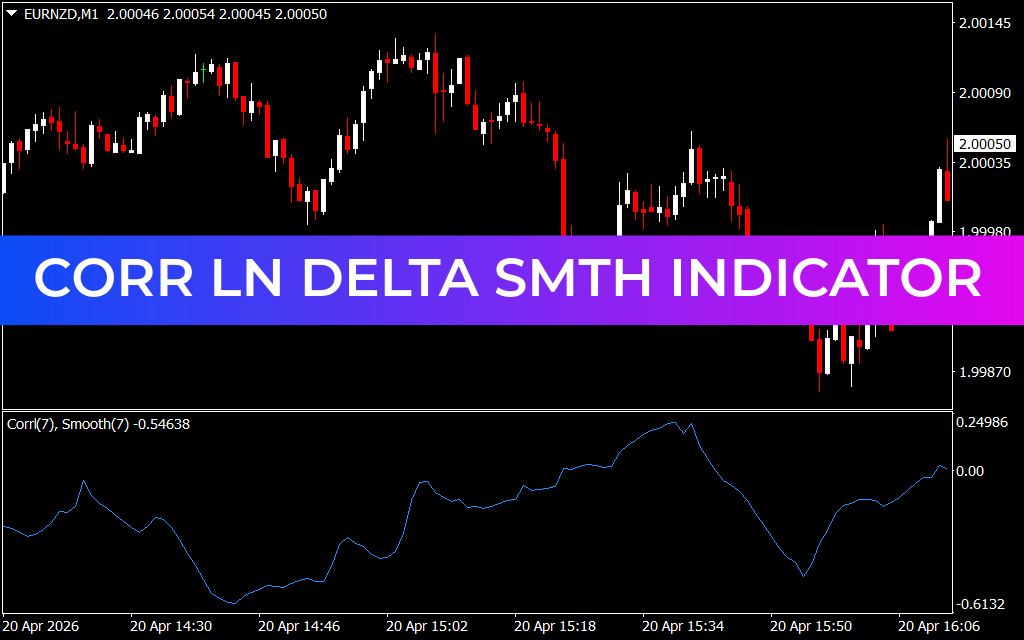
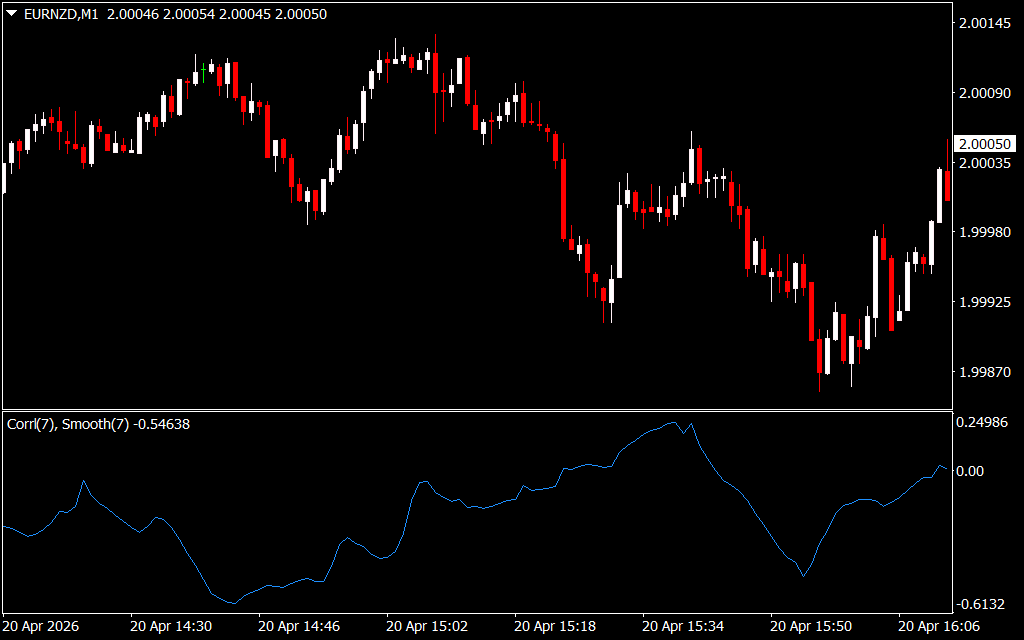
As visualized on the EURNZD M1 chart, the indicator operates in a dedicated sub-window with several key features:
- The Zero-Line Anchor: The zero line acts as the threshold for trend conviction. When the indicator is trending above zero, the market is exhibiting positive correlation and bullish momentum.
- Smoothed Trajectory: By applying a linear smoothing algorithm, the indicator avoids the "spikiness" of standard oscillators, making it easier for traders to hold positions during minor retracements.
- Dynamic Oscillations: The line fluctuates between defined upper and lower bounds, providing a clear visual representation of when a trend is accelerating or beginning to diverge from the mean.
Strategic Trading and Trend Validation
The Corr Ln Delta Smth Indicator is particularly effective for intraday traders on the 1-minute (M1) or 5-minute (M5) timeframes, where market noise is highest.
- Trend Confirmation: One of the most robust uses for the indicator is as a secondary filter. For example, if a trader sees a bullish breakout on the main chart, they look for the Corr Ln Delta Smth to be rising above the zero line to confirm that the move is backed by consistent market correlation.
- Divergence Analysis: When the price makes a new high but the indicator produces a lower peak, it signals "Correlation Decay." This is a powerful warning that the current trend is becoming inefficient and a reversal or consolidation is likely imminent.
- Cross-Over Signals: Aggressive traders often use the zero-line cross as a direct entry or exit trigger. A cross from negative to positive territory signals a fresh surge of buying pressure, while a dip below zero suggests that sellers are gaining the upper hand.
Why Your MetaTrader Setup Needs This Edge
The primary advantage of the Corr Ln Delta Smth Indicator is its statistical objectivity. In a market often driven by emotion, this tool provides a cold, mathematical look at how well price movements are correlating with their own recent history. For a technical pair like EURNZD, having a smoothed delta filter allows you to ignore the "fakeouts" and focus on moves with genuine structural integrity.
Whether you are a scalper seeking quick bursts of momentum or a swing trader looking for reliable trend validation, the Corr Ln Delta Smth Indicator provides the precision needed for modern markets. It transforms your MetaTrader interface into a professional analytical dashboard, ensuring your trading decisions are always supported by data-driven correlation analysis.
1 Download
Last Update:
Apr 20, 2026 22:41 PM
Published:
Feb 03, 2026 13:28 PM
Category: