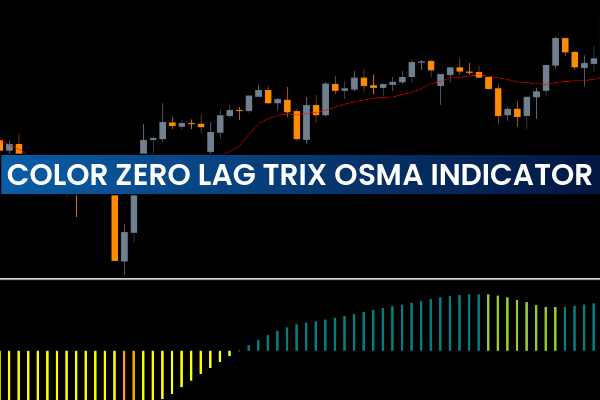
The Color Zero Lag TRIX OSMA Indicator for MT5 is a simple, user-friendly technical tool that uses colored histogram bars to indicate trend momentum. Built on the principles of the moving average oscillator, this indicator helps traders quickly determine bullish or bearish market conditions. One of its greatest advantages is versatility—you can use it on any financial instrument and any timeframe, whether you trade forex, indices, metals, crypto, or stocks.
This indicator provides MACD-like visual signals in a separate window, making it easy to interpret momentum strength without cluttering the main chart. Its color-coded approach enhances visibility, which is especially useful for new traders or those who prefer clean, straightforward tools.
How the Color Zero Lag TRIX OSMA Indicator Works
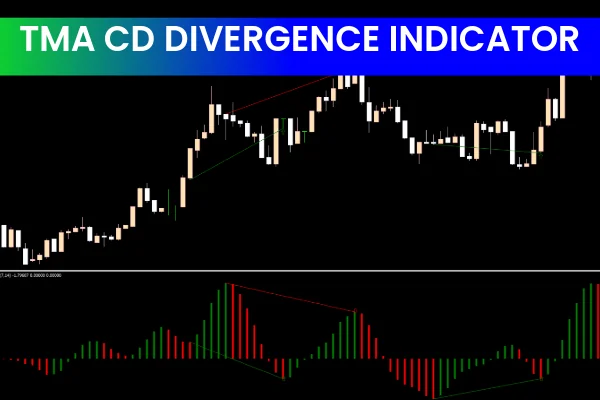
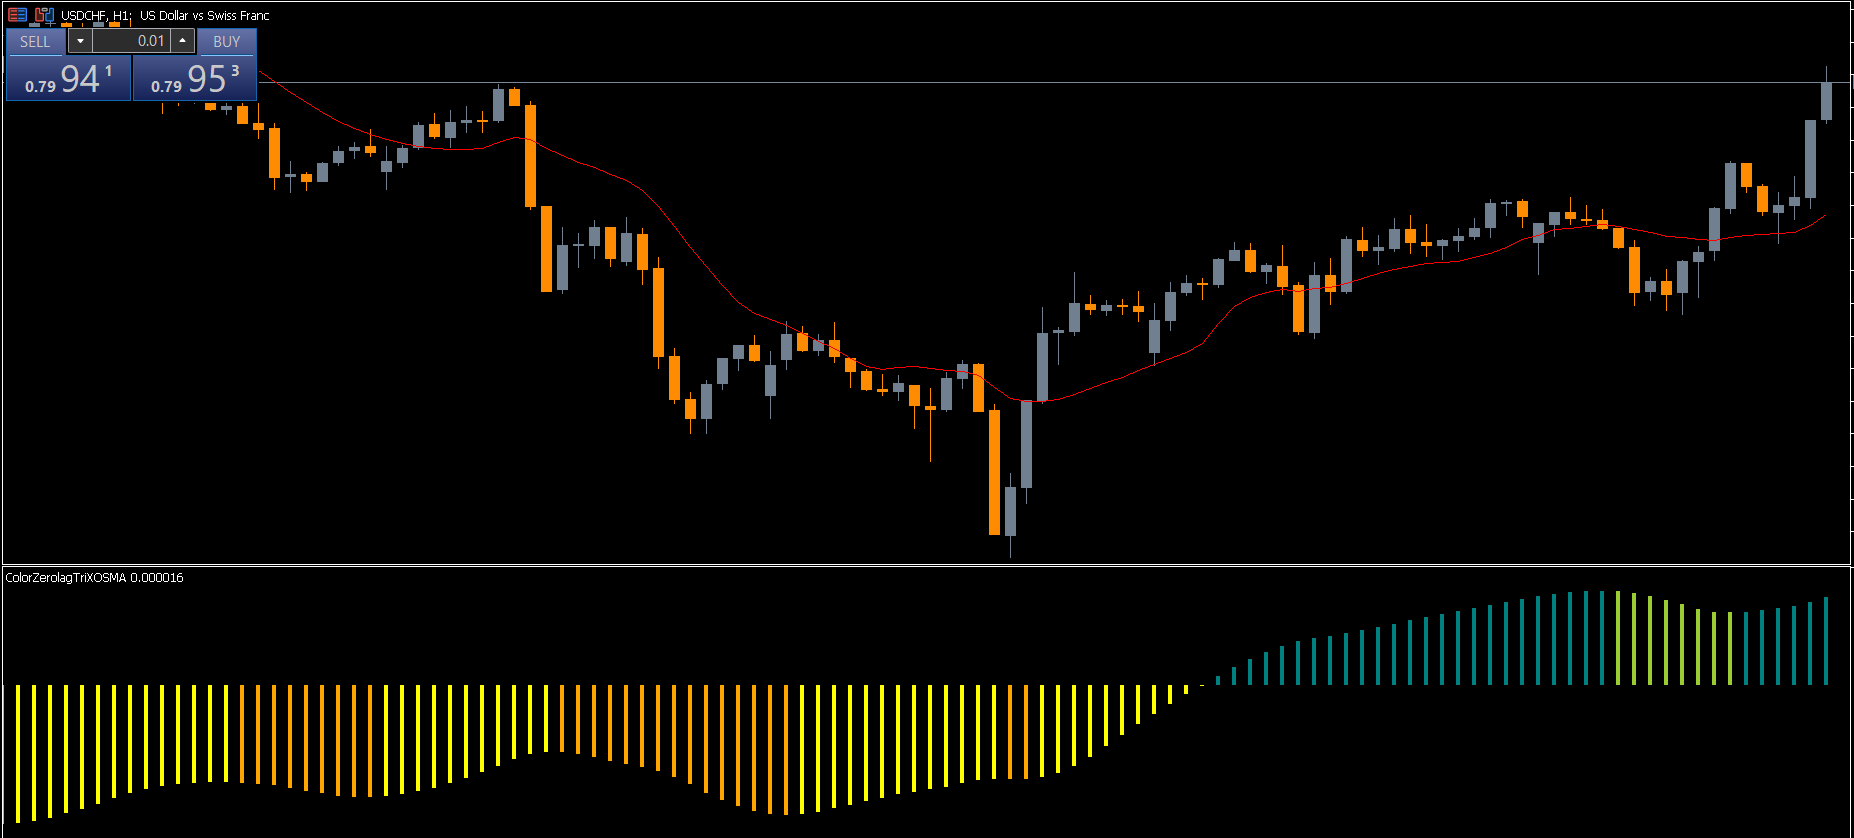
The indicator places histogram bars below the main chart, similar to the MACD. These bars shift above or below the zero line depending on market momentum. Two key components form the basis of its signal-generating system:
Histogram Position Relative to the Zero Line
The zero line acts as a dividing point:
Above the Zero Line: Bullish pressure
Below the Zero Line: Bearish momentum
Where the bars form relative to this central point indicates the direction of market strength.
Color of the Histogram Bars
The indicator uses two main colors:
Green Bars: Indicate bullish momentum
Orange Bars: Indicate bearish pressure
This makes reading the indicator very intuitive—green for buying pressure and orange for selling pressure.
Buy and Sell Signals Explained
Because the Color Zero Lag TRIX OSMA Indicator is designed to show pure momentum, its signals are highly visual and easy to follow.
BUY Signal – Green Bars Above Zero Line
A bullish signal occurs when:
Green histogram bars appear above the center (zero) line
The bars begin to elongate, showing strengthening momentum
The longer the green bars become, the stronger the bullish momentum. Traders can look for:
Breakouts
Trend continuation setups
Bullish Candlestick Patterns for confirmation
SELL Signal – Orange Bars Below Zero Line
A bearish signal occurs when:
Orange bars form below the zero line
Bars extend downward, indicating increasing bearish pressure
This setup suggests strong seller dominance. Traders often combine this with:
Trendline breaks
Resistance retests
Bearish reversal candlestick patterns
Color Zero Lag TRIX OSMA Trading Example
A typical trading example would show the histogram gradually shifting colors as the market transitions between bullish and bearish phases. When the bars switch from orange to green and cross above the zero line, buyers are gaining control. Conversely, when the bars switch from green to orange and drop below the zero line, the market sentiment turns bearish.
This smooth visual transition helps traders:
Spot reversals early
Identify momentum strength
Confirm existing trends
Avoid false signals when combined with Price Action
Best Practices for Using the Indicator
Combine with Price Action
Candlestick patterns such as engulfing, hammer, or pin bar formations help validate entry signals.
Use Trend Filters
Higher timeframe EMAs or trendlines can reduce false momentum shifts.
Pay Attention to Histogram Length
Long bars indicate powerful momentum—use this to gauge trend continuation.
Suitable for All Timeframes
Whether Scalping M1 or swing trading D1 charts, the indicator performs consistently.
Conclusion
The Color Zero Lag TRIX OSMA Indicator for MT5 is a clean, efficient tool for identifying bullish and bearish momentum using colored histogram bars. Its zero line structure combined with color-coded signals makes it perfect for beginners as well as experts. Since it works across all instruments and timeframes, it is a valuable addition to any trading strategy.
You can download this indicator for free at IndicatorForest.com and start using it to enhance your momentum-based trading.
FAQ
3 Downloads
Published:
Nov 18, 2025 11:29 AM
Category: