The Candles Ratio V1 Indicator for MT4 is a powerful and easy-to-use oscillator that measures the ratio between bullish and bearish candles within a specific period. By analyzing these ratios, forex traders gain insight into which side—buyers or sellers—is dominating the market. This makes it an excellent tool for identifying market sentiment, potential reversals, and entry or exit points in any trading session.
Unlike complex technical tools, this indicator is simple enough for both beginner and advanced traders to interpret. It works seamlessly across all timeframes, from intraday charts to higher timeframes, making it highly versatile for multiple trading styles.
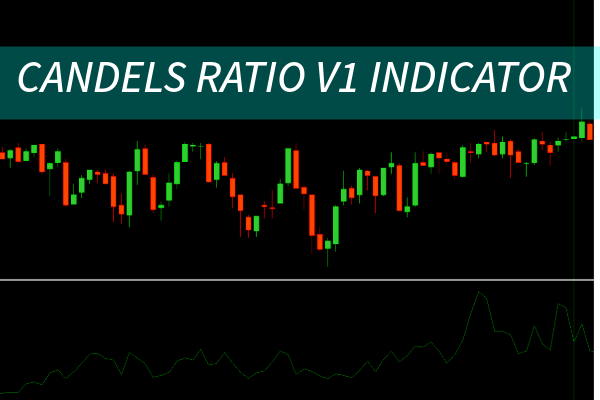
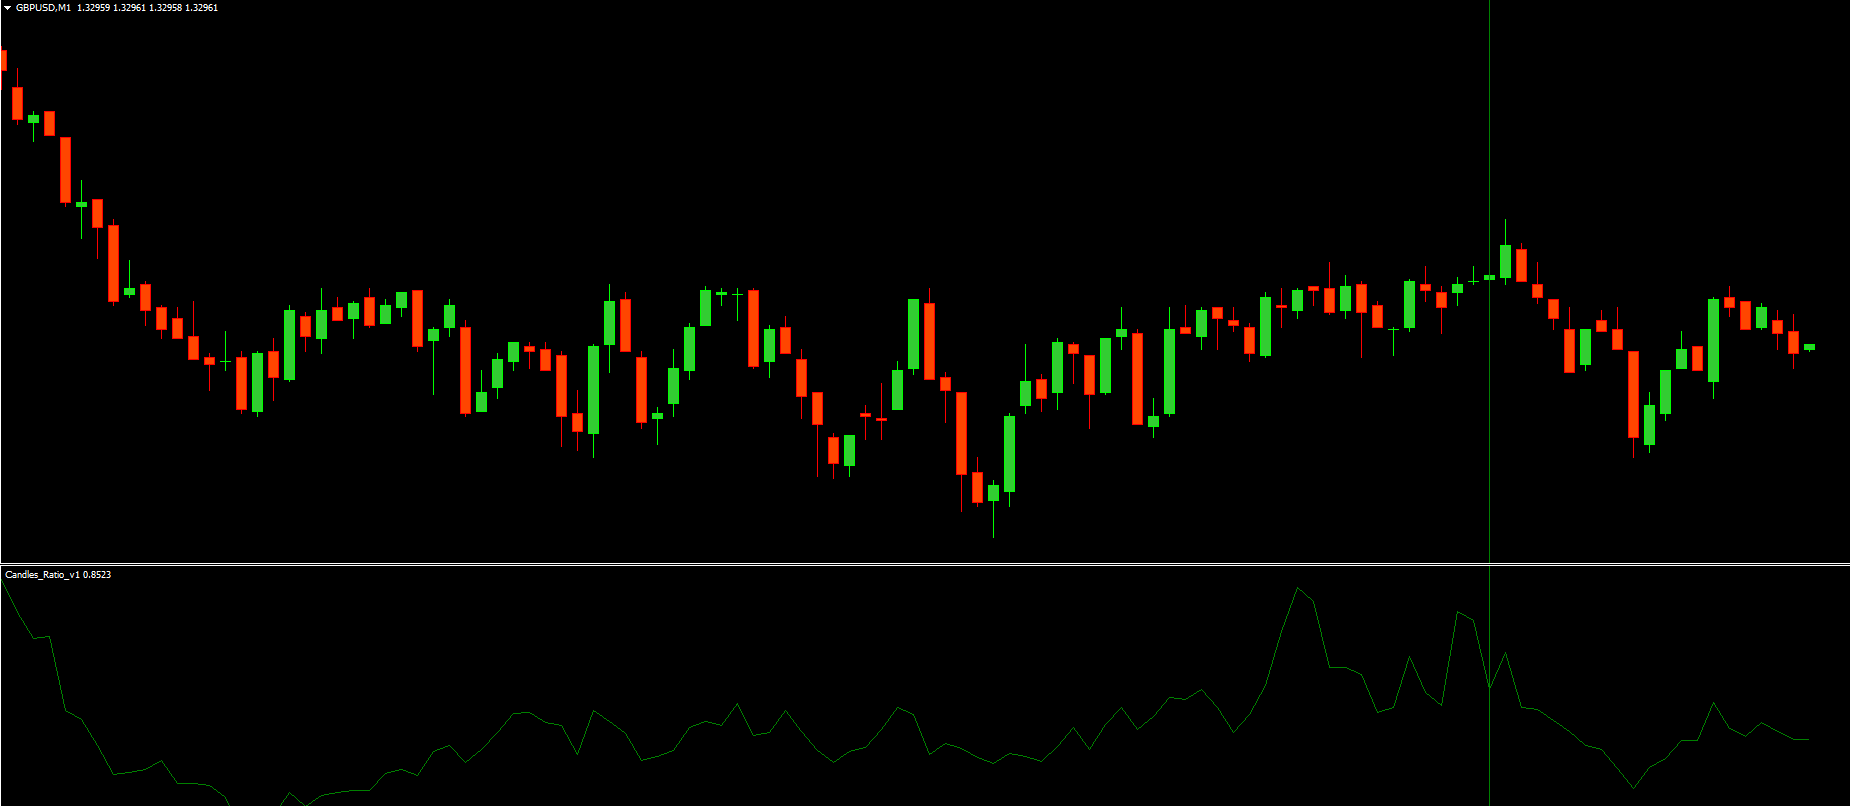
The Candles Ratio V1 Indicator for MT4 plots a green oscillator line in a separate indicator window. This oscillator reflects the ratio between bullish and bearish candles over a given lookback period.
Rising Oscillator Values: Indicate an increase in bullish strength. The buyers are in control, and prices are likely to continue upward.
Falling Oscillator Values: Suggest bearish dominance, signaling potential downward price movement.
Traders often draw support and resistance levels directly on the oscillator window. These levels help identify potential reversals, where market momentum shifts from one side to the other.
Bullish Trade Setup
When the oscillator starts turning upward after a decline, it signals that bullish momentum may be returning.
Entry: Open a buy trade when the oscillator reverses upward from a support zone.
Stop Loss: Place below the previous swing low.
Take Profit: Target resistance zones or a fixed reward-to-risk ratio.
Bearish Trade Setup
When the oscillator line peaks and begins to move downward, it reflects growing bearish strength.
Entry: Open a sell trade when the oscillator reverses downward from a resistance level.
Stop Loss: Place above the previous swing high.
Take Profit: Look for reversal zones or key support levels.
This simple approach allows traders to follow the market participants’ ratio—a direct way to spot the underlying sentiment.
The Candles Ratio V1 Indicator for MT4 performs best when combined with other technical tools for confirmation.
Use it alongside Moving Averages, RSI, or MACD to strengthen trade signals.
Identify divergences between price and oscillator for early reversal warnings.
Mark support and resistance levels directly on the oscillator to anticipate price turning points.
Since the indicator works on all timeframes, day traders can use it on M15 or M30 charts, while swing traders can benefit from H4 or Daily charts.
Easy Interpretation: Straightforward oscillator for quick sentiment analysis.
Universal Application: Works on all forex pairs and timeframes.
Supports Technical Analysis: Complements existing strategies and indicators.
Ideal for All Levels: Suitable for both beginners and experienced traders.
By understanding the oscillator’s behavior, traders can confidently determine when buyers or sellers dominate—leading to smarter and more profitable trade decisions.
In summary, the Candles Ratio V1 Indicator for MT4 is a simple yet effective oscillator that helps forex traders analyze market sentiment. By observing the ratio between bullish and bearish candles, traders can identify market dominance, time their entries and exits, and refine their overall trading strategy.
To download and learn more about advanced MT4 tools, visit IndicatorForest.com today and explore a wide range of free and premium forex indicators.
Published:
Oct 09, 2025 14:06 PM
Category: