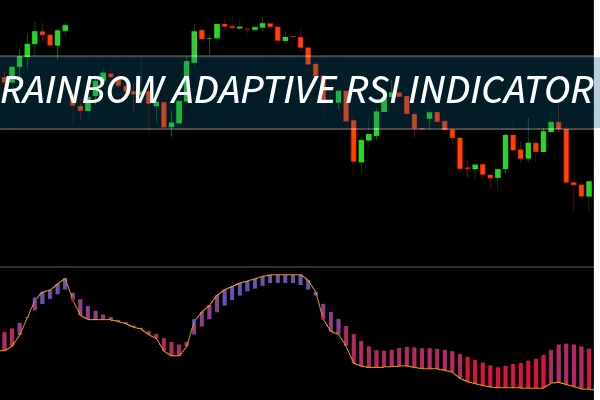
The Rainbow Adaptive RSI is a modern, visually enriched evolution of the classic Relative Strength Index—and a must-have for traders using MetaTrader 4 (MT4). Developed by the innovative team behind the LuxAlgo suite, this tool adapts its sensitivity in real time, reflecting market momentum through smooth gradient color bands. At its core, the Rainbow Adaptive RSI aims to help traders identify reversals, momentum shifts, and overbought or oversold conditions more intuitively than ever before.
Unlike standard RSI tools, this version dynamically adjusts to current price volatility, offering a clearer, more fluid representation of strength and weakness. The color-coded design provides immediate visual feedback, allowing traders to react faster and stay aligned with prevailing market momentum.
The Rainbow Adaptive RSI indicator operates on two main principles: adaptive sensitivity and visual signaling.
Adaptive Sensitivity:
The indicator automatically modifies its reaction speed based on market conditions. During sideways or consolidating markets, it smooths out minor fluctuations to minimize noise and false signals. When markets trend strongly, the indicator becomes more responsive, capturing momentum shifts with greater precision.
Visual Gradient Display:
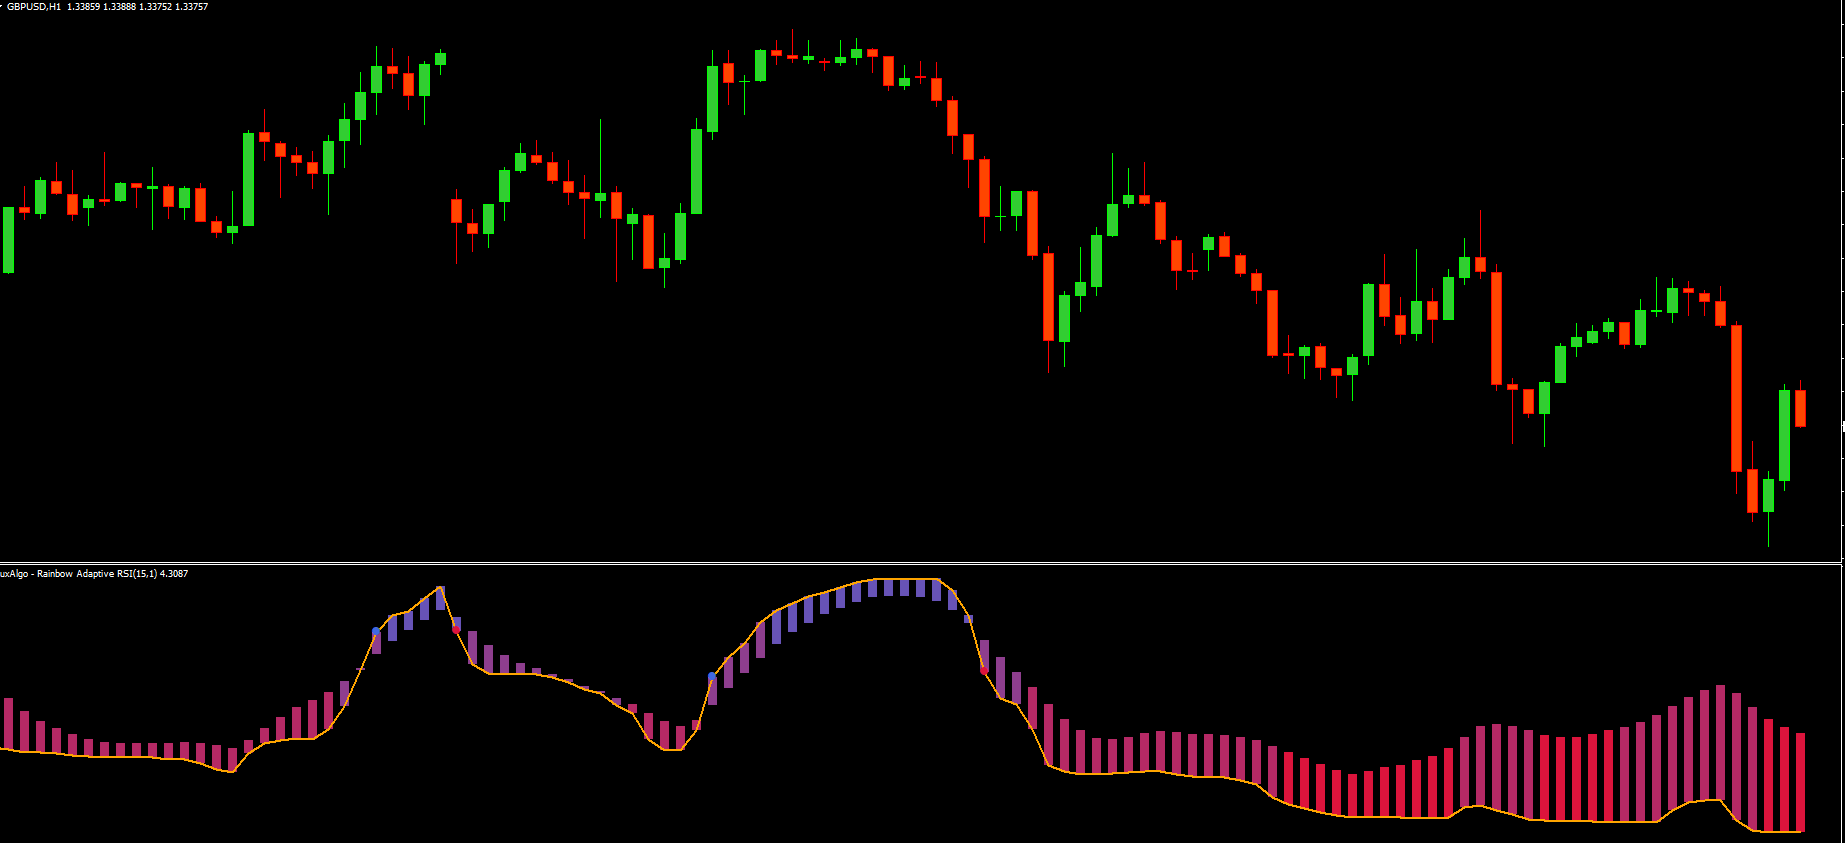
The RSI curve changes color intensity to reflect momentum strength.
When the RSI accelerates upward, it transitions into royal blue, signaling robust bullish momentum.
As it turns downward, the curve shifts to crimson, indicating bearish pressure.
Colored round dots appear at the RSI peaks and troughs, marking potential reversal zones or overbought/oversold areas.
This intuitive design means traders can interpret market rhythm visually, reducing cognitive load and decision lag.
The trading signals generated by the Rainbow Adaptive RSI are both color-coded and shape-based, making them extremely easy to interpret:
Bullish Momentum (Blue Gradient):
When the RSI line glows blue and rises sharply, it indicates strong buying power. This is often a sign of potential trend continuation or the early stages of an uptrend.
Bearish Momentum (Crimson Gradient):
A descending red curve highlights increasing selling pressure. This is typically associated with downtrend continuation or reversal opportunities.
Overbought and Oversold Zones (Round Dots):
The indicator plots circular dots at RSI extremes. These dots frequently align with local tops and bottoms on the price chart, providing clear visual cues for potential entry or exit points.
Thanks to its adaptive engine, the indicator reduces false alerts during choppy markets while maintaining responsiveness during strong trends—something most traditional RSI tools struggle to achieve.
Visual Clarity: The gradient color scheme enhances readability.
Reduced Noise: Adaptive logic filters minor oscillations.
Faster Reaction Time: Visual signals allow quicker trade decisions.
Compatibility: Fully functional on MetaTrader 4, making it easy to integrate with other tools or templates.
Enhanced Confidence: Traders can stay synchronized with market direction without over-analyzing every tick.
This indicator bridges the gap between data precision and visual intuition, making it suitable for both novice and professional traders.
The Rainbow Adaptive RSI can be applied to multiple trading strategies, including:
Trend Following: Stay in trades longer by visually confirming the trend direction.
Reversal Trading: Identify exhaustion points when color and shape cues converge.
Momentum Confirmation: Use alongside moving averages or volatility bands for higher accuracy.
For best results, traders often pair this indicator with other Forex indicators bundles available at IndicatorForest.com, creating a well-rounded toolkit for momentum and trend analysis.
The Rainbow Adaptive RSI from LuxAlgo redefines traditional RSI analysis by merging adaptive logic with an intuitive, color-coded design. It simplifies trend reading, enhances accuracy, and adds a new dimension to momentum interpretation on MT4. Whether you’re a beginner exploring the markets or an experienced trader optimizing your edge, this indicator offers an elegant and efficient way to understand price dynamics.
Visit IndicatorForest.com to download this and other advanced Forex indicators, and take your trading precision to the next level.
Published:
Oct 09, 2025 06:51 AM
Category: