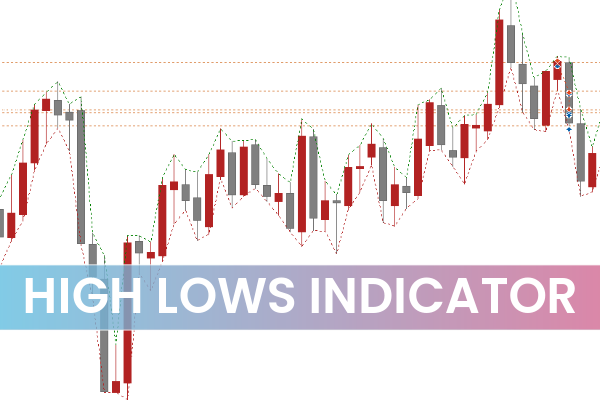
The High Lows Indicator for MT5 is a simple yet highly effective technical analysis tool designed to display the daily highest and lowest price levels. By linking these levels with continuous lines, traders can easily identify price trends, potential breakouts, and strong reversal zones across different timeframes.
The indicator automatically draws two key lines:
A red line connecting daily highs.
A dark turquoise line connecting daily lows.
This visual representation allows traders to clearly see whether the market is forming higher highs and higher lows (bullish trend) or lower highs and lower lows (bearish trend).
Since the High Lows indicator can be viewed on any chart timeframe, it is suitable for intraday, swing, and position traders who rely on trend continuation and breakout strategies.
How the High Lows Indicator for MT5 Works
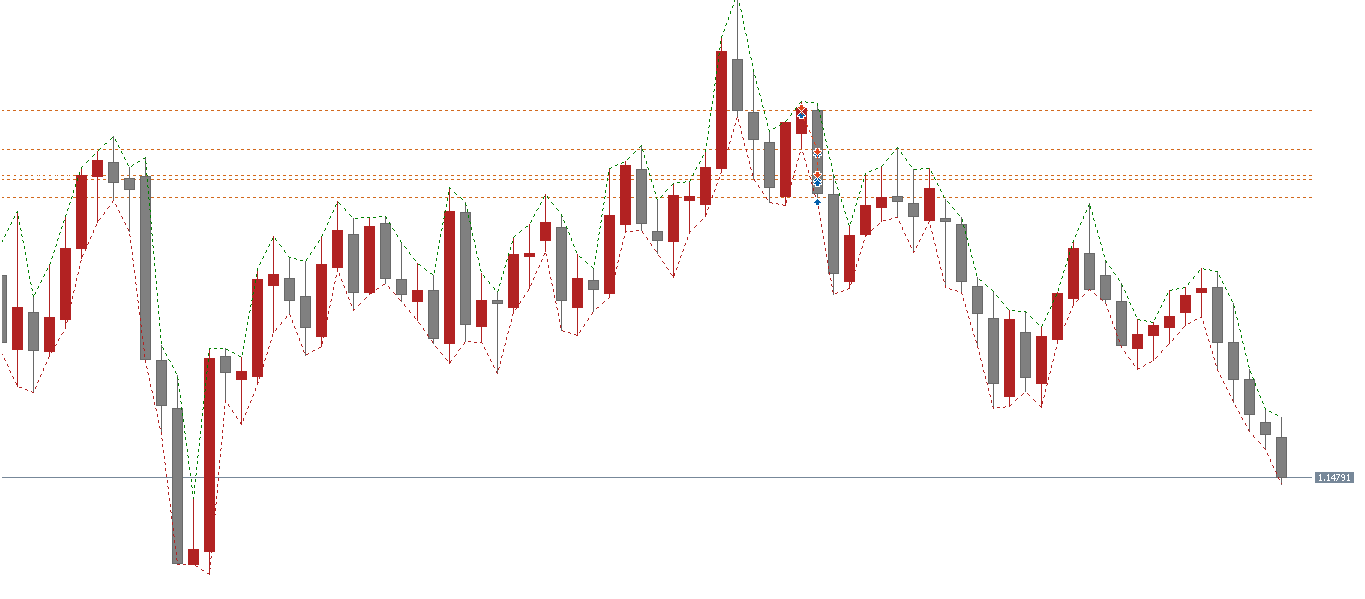
The High Lows Indicator automatically extracts and plots the highest and lowest price levels from each trading day. As new daily candles form, the indicator updates the lines, connecting each day’s highs and lows in real time.
These visual cues help traders instantly recognize the direction of the market and possible entry points for continuation or breakout trades.
Red Line: Represents the daily highs — breakouts above this level often confirm bullish momentum.
Dark Turquoise Line: Represents the daily lows — breakouts below this level suggest bearish momentum.
This structure helps traders identify strong directional moves and align trades with the dominant market trend.
High Lows Indicator for MT5 Trade Setup
Identifying a Bullish Trend
A market is considered bullish when both the highs and lows are rising:
The price consistently forms higher highs and higher lows.
The red (high) and turquoise (low) lines slope upward.
A break above the previous day’s high signals strong buying momentum.
Buy Setup Example:
Confirm that the current day’s low is higher than the previous day’s low.
Wait for the price to break above the previous day’s high (the red line).
Enter a buy position once the breakout is confirmed.
Stop Loss: Below the previous day’s low.
Take Profit: Near the next resistance level or when a reversal signal appears.
Identifying a Bearish Trend
A market is bearish when the highs and lows are declining:
The price forms lower highs and lower lows.
The red and turquoise lines slope downward.
A break below the previous day’s low signals strong selling momentum.
Sell Setup Example:
Confirm that the current day’s high is lower than the previous day’s high.
Wait for the price to break below the previous day’s low (the turquoise line).
Enter a sell position once the breakout occurs.
Stop Loss: Above the previous day’s high.
Take Profit: Near the next support level or when a bullish reversal is detected.
Advantages of Using the High Lows Indicator for MT5
Simple and Clear Visualization – Easily spot bullish or bearish Market Structure through color-coded lines.
Multi-Timeframe Functionality – Works effectively on all chart periods, from M1 to D1 and higher.
Accurate Trend Identification – Helps confirm breakout levels and potential continuation signals.
Perfect for All Traders – Useful for new traders learning market structure and experienced traders refining their entries.
Versatile Application – Effective for Scalping, day trading, and swing trading strategies.
Pro Tips for Trading with the High Lows Indicator
Combine with Volume Indicators: Confirm breakouts using a volume spike for higher accuracy.
Use in Confluence with Support/Resistance: Align daily highs/lows with key horizontal levels to find strong trade zones.
Apply Multi-Timeframe Analysis: Check the trend direction on higher timeframes (like D1 or W1) before taking trades on lower ones.
Avoid False Breakouts: Wait for a candle to close beyond the daily high/low before entering.
Conclusion
In summary, the High Lows Indicator for MT5 is an excellent trend-following tool that simplifies market structure analysis. By connecting daily highs and lows, it allows forex traders to spot trend direction, trade breakouts, and make better-informed decisions.
Whether you are a beginner learning Price Action or an advanced trader refining entries, this indicator provides clear visual cues to support your trading strategy.
You can download the High Lows Indicator for MT5 for free from IndicatorForest.com and start mastering trend and breakout trading today.
3 Downloads
Published:
Nov 04, 2025 16:01 PM
Category: