Mastering Market Sentiment with the Bears Power Indicator
In the competitive world of Forex and stock trading, understanding the tug-of-war between buyers and sellers is the key to longevity. While many traders rely solely on Price Action, professional technical analysts often turn to oscillators to gauge the hidden strength of market participants. One of the most reliable tools for this is the Bears Power Indicator, a cornerstone of the Alexander Elder "Elder-Ray" trading system.
What is the Bears Power Indicator?
The Bears Power Indicator is designed to measure the "appetite" of sellers in the market. It calculates the difference between the lowest price of the current period and an exponential moving average (EMA), typically set to 13 periods. Mathematically, it is expressed as:
$$Bears\ Power = Low\ price - EMA$$
When the histogram is below the zero line, it indicates that the bears (sellers) have managed to push the price below the average value, signaling bearish dominance. Conversely, a move toward the zero line suggests that selling pressure is waning.
Decoding the Histogram
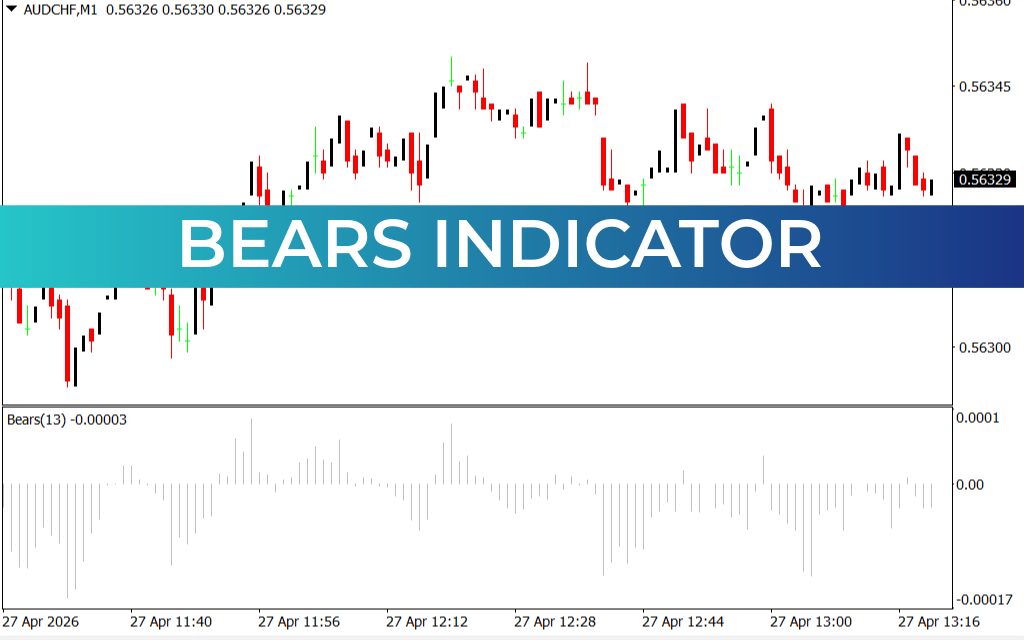
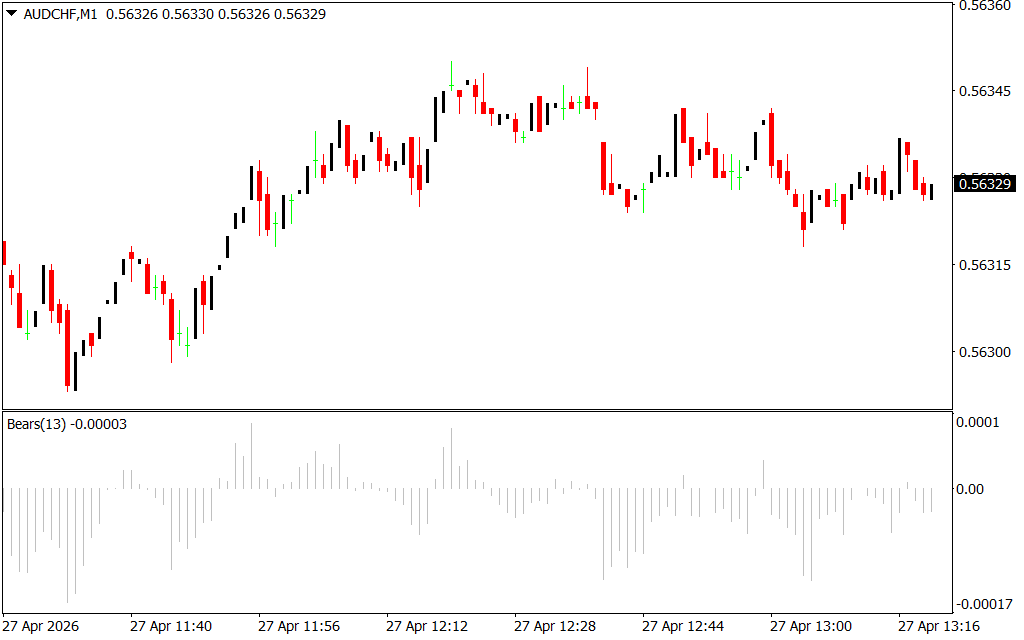
As seen in the provided AUD/CHF M1 chart, the Bears Power indicator appears as a series of vertical bars in a sub-window.
- Deepening Negative Bars: When the bars grow longer below the zero line, it confirms a strong downward momentum. Sellers are aggressive and in total control.
- Rising Toward Zero: If the price hits a new low but the Bears Power indicator shows a shallower trough (a bullish divergence), it is a major warning sign. This suggests that while the price is dropping, the bears are losing their conviction, often preceding a Trend Reversal.
Strategic Trading with Bears Power
The Bears Power indicator is rarely used in isolation. To maximize its effectiveness, it is best paired with a trend-following tool like the Bulls Power indicator or a 13-period EMA.
- Trend Confirmation: If the overall trend (determined by the EMA) is downward and the Bears Power histogram is below zero and falling, it provides a high-probability "Sell" signal.
- Spotting Reversals: The "Holy Grail" for many traders is identifying the end of a downtrend. When the Bears Power indicator is negative but starts rising while the price is still falling, it indicates "exhaustion." This is the moment smart money starts looking for "Buy" opportunities as the bears retreat.
- Filtering Noise: On lower timeframes like the M1 chart shown, the Bears Power helps filter out minor price spikes, allowing traders to see if a quick move up is a genuine recovery or just a temporary pause in a larger sell-off.
Conclusion
The Bears Power indicator is an essential asset for any trader looking to quantify market sentiment. By revealing the strength of the "bears" relative to the average price, it provides a logical, mathematical foundation for m
1 Download
Last Update:
Apr 27, 2026 16:22 PM
Published:
Feb 01, 2026 13:15 PM
Category: