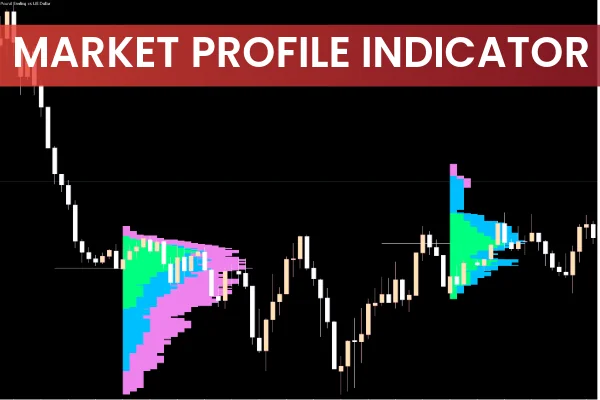
The Market Profile Indicator is a sophisticated trading tool that displays price density over time, helping traders identify important price levels, ranges, and benchmarks for specific trading sessions. By combining volume, time, and tick data, the indicator creates a detailed picture of market activity to highlight areas of high and low trading interest.
What Is the Market Profile Trendlines Indicator?
The Market Profile indicator was originally developed at the Chicago Board of Trade (CBOT) to visually represent price and time data from a trading session. The MP Trendlines indicator is an enhanced version that includes trend lines and calculates where the most price activity occurs for any market or currency pair.
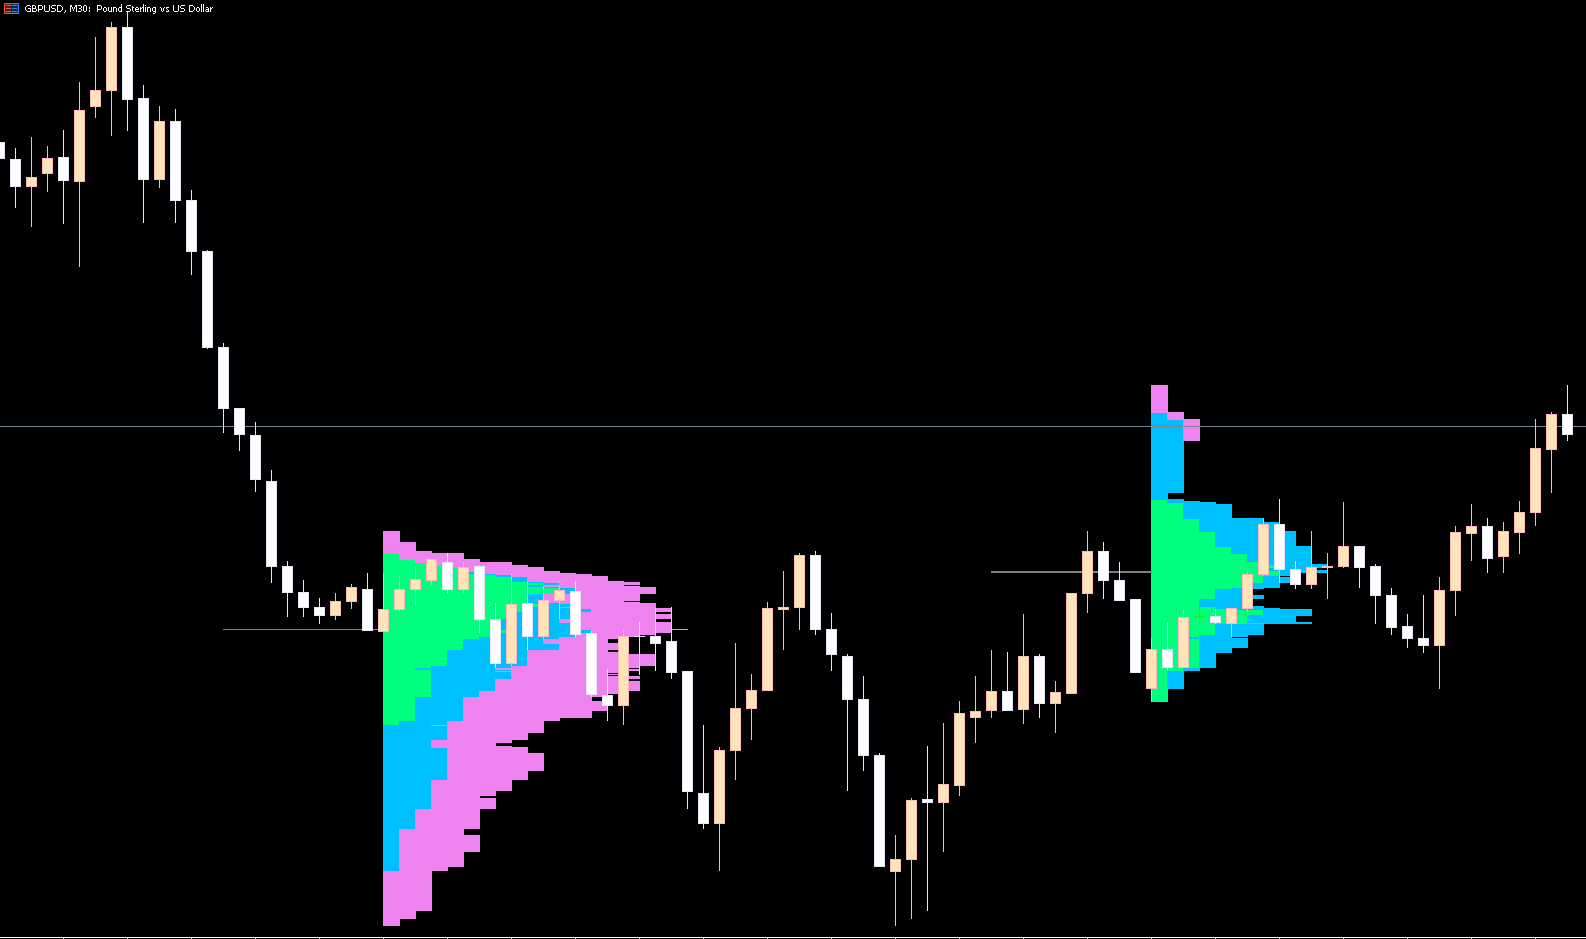
Unlike standard indicators, it generates a histogram based on tick-by-tick data, displaying zones where trading is most active. This histogram runs from right to left, allowing traders to focus on the current session without cluttering the chart.
The indicator is versatile and can be applied to any timeframe from M1 to D1, showing detailed trading session profiles based purely on Price Action.
How to Use the Market Profile Indicator
The value area is the key concept for trading with the Market Profile indicator. It represents the midpoint between Supply And Demand during a session.
Upper and lower tails:
Lower tail: Buyers are dominating at these levels.
Upper tail: Sellers are controlling the market.
Traders can use this data to determine potential buy and sell opportunities.
Market Profile Trading Strategy
Buy Setup:
Identify the lower boundary of the profile.
Wait for the price to turn bullish.
Place a stop loss near the recent low.
Exit the trade when the trend reverses.
Sell Setup:
Identify the upper boundary of the profile.
Wait for the price to turn bearish.
Place a stop loss near the recent high.
Exit the trade when the trend reverses.
Benefits of the Market Profile Indicator
Highlights key price levels, value areas, and trading ranges
Visualizes supply and demand zones for accurate trade timing
Displays trading activity and market behavior using tick data
Works across all timeframes (M1 to D1)
Complements other technical tools like moving averages
Free to download and easy to install on MT4 and MT5
Call to Action
Gain deeper insight into market behavior with the Market Profile Indicator. Download it for free from IndicatorForest.com and start analyzing price density, key levels, and trends for more informed trading decisions.
FAQ
8 Downloads
Published:
Nov 21, 2025 01:17 AM
Category: