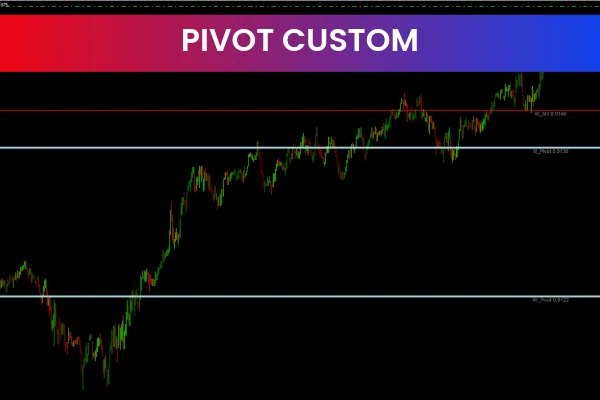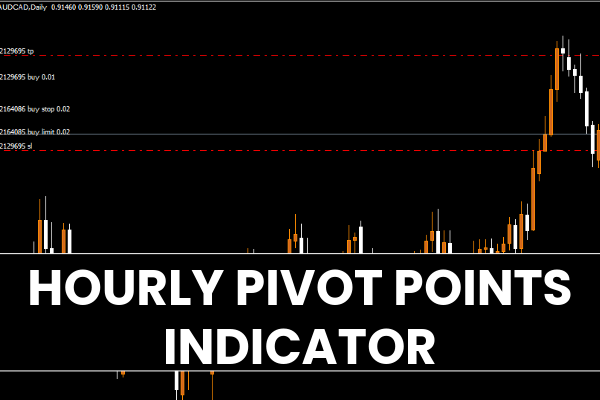
The Hourly Pivot Points Indicator for MT4 is a simple yet effective tool that helps traders identify key Support And Resistance levels on the hourly chart. It automatically plots three support (S1, S2, S3) and three resistance (R1, R2, R3) levels, giving traders a clear visual map of where price may reverse or consolidate.
Support levels are highlighted in green, indicating potential buy zones, while resistance levels are marked in red, signaling possible sell zones. Additionally, the indicator plots a central pivot line, which serves as a reference point for determining market direction and possible trend reversals.
As the name suggests, this indicator works exclusively on the hourly (H1) timeframe, making it ideal for intraday traders who prefer short-term setups.
How the Hourly Pivot Points Indicator Works
The pivot line is calculated based on the previous hour’s high, low, and close prices. From this central point, the indicator projects support and resistance zones for the upcoming hour.
When the price trades above the pivot line, it signals a bullish bias.
When the price trades below the pivot line, it indicates a bearish bias.
This structure allows traders to anticipate potential turning points and adjust their trading strategy accordingly.
Hourly Pivot Points Indicator BUY/SELL Signals
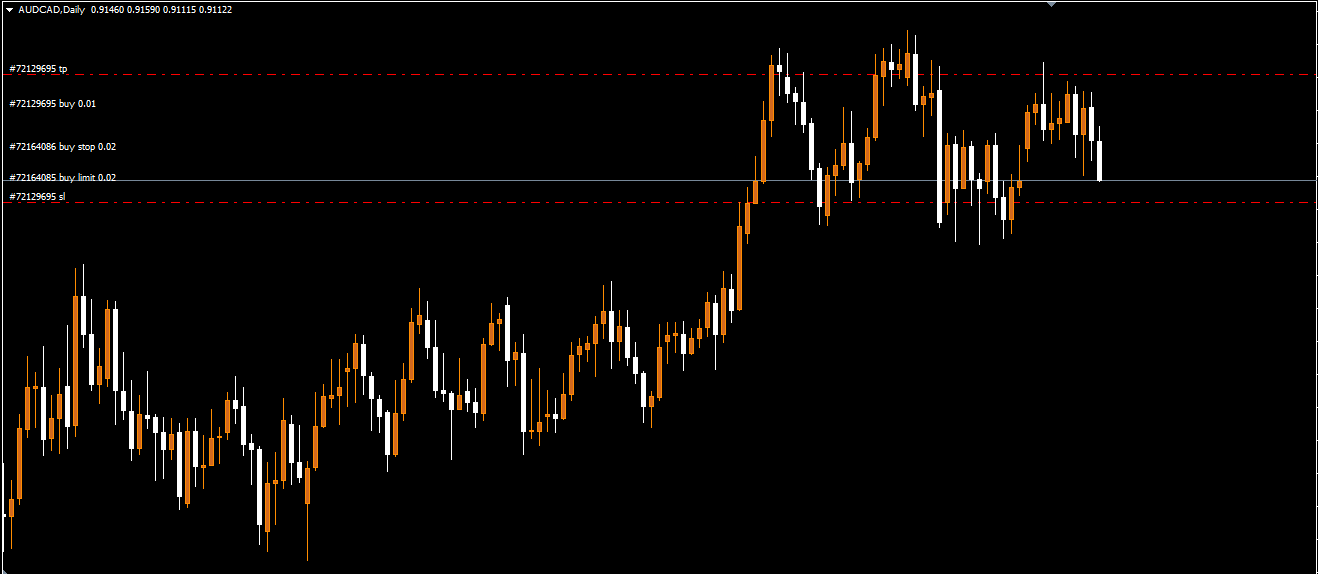
The EUR/USD H1 chart shown above demonstrates how the indicator functions. The trading logic is simple and follows classical support and resistance principles:
BUY Signal: When the price approaches or touches a support level (S1–S3) and shows signs of rejection, traders may open a long position.
SELL Signal: When the price nears a resistance level (R1–R3) and shows bearish momentum, traders can enter a short position.
Since the Hourly Pivot Points Indicator is designed for quick entries and exits, traders are advised to use tight stop-loss and take-profit levels. This ensures trades remain aligned with short-term market movements.
For the best results, combine the indicator with tools like the Moving Average, RSI, or MACD to confirm trend direction before entering trades.
What Indicators Work Best with Pivot Points?
Pivot points work best when used in combination with other technical indicators to confirm potential trade setups. Commonly used tools include:
Moving Average (MA): Helps identify the broader trend direction.
Fibonacci Extension: Assists in projecting future price targets.
Momentum Indicators: Such as RSI or MACD for entry confirmation.
Using these indicators alongside the Hourly Pivot Points Indicator can improve trade accuracy and help traders make more confident decisions.
Do Professional Traders Use Pivot Points?
Yes, professional traders frequently use pivot points as part of their trading strategy. They serve as objective reference levels that reflect market sentiment and key reaction zones.
With the Hourly Pivot Points Indicator for MT4, traders can easily visualize three support and three resistance levels directly on their charts, removing the guesswork from manual calculations.
This makes the indicator a valuable tool for traders looking to refine their entry and exit timing.
Conclusion
The Hourly Pivot Points Indicator for MT4 is a practical and reliable tool for identifying intraday support and resistance zones. By understanding how price behaves around these levels, traders can make more precise decisions about when to buy or sell.
The added pivot line helps highlight potential reversal points, making this indicator especially useful for scalpers and short-term traders.
You can download the Hourly Pivot Points Indicator for free from our website and start improving your technical analysis today.
FAQ
1 Download
Published:
Nov 07, 2025 10:42 AM
Category: