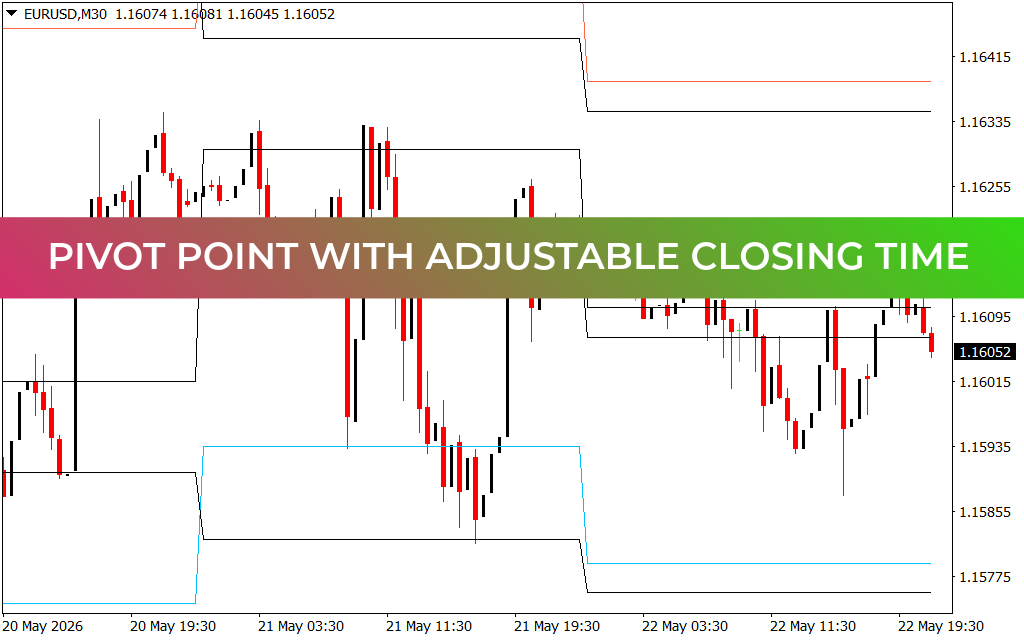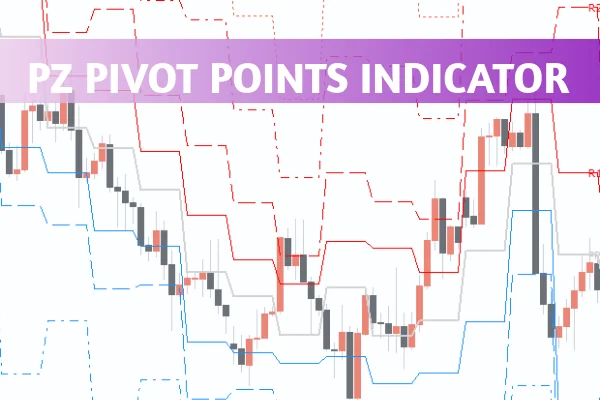
The PZ Pivot Points Indicator is a powerful tool that helps forex traders identify key Support And Resistance levels using multiple pivot point calculation methods. It’s one of the most effective ways to analyze market trends and improve your trading strategy.

Backtesting is one of the hardest yet most valuable parts of trading. With the PZ Pivot Points Indicator, traders can easily visualize historical pivot levels to evaluate past market behavior and develop reliable strategies. This makes it ideal for both beginners and advanced traders looking to fine-tune their entries and exits.
How the PZ Pivot Points Indicator Works
The indicator automatically calculates pivot points and displays them directly on your chart. These points include a central pivot, multiple support (S1–S4), and resistance (R1–R4) levels.
The PZ Pivot Points Indicator supports several popular calculation modes, such as:
Classic Pivot Points Formula
Woodie Method
Camarilla Formula
These formulas use the previous day’s high, low, and close prices to determine the market’s turning points. As a result, traders can quickly identify potential breakout and reversal zones across different timeframes.
You can also fully customize the indicator — adjust the colors, line thickness, and calculation modes to match your preferred charting style.
Why Traders Use PZ Pivot Points for Backtesting
Backtesting helps traders validate their strategies using historical data before applying them in live markets. The PZ Pivot Points Indicator makes this process easier by displaying past pivot levels, allowing you to test how price reacts at those key levels.
You can compare multiple timeframes and determine which one aligns best with your strategy. For instance:
Scalpers can use M15 or M30 charts for short-term trades.
Swing traders may prefer H4 or Daily charts for broader trends.
By combining pivot point zones with other technical tools—like moving averages or candlestick patterns—you can confirm entry and exit signals more effectively.
PZ Pivot Points Trading Example
Trading with the PZ Pivot Points Indicator is simple. The indicator provides clear entry, stop-loss, and take-profit levels.
For example:
If the EUR/USD pair is trading at 1.14817, you could:
Enter Buy: at 1.14817
Take Profit: at resistance levels R1 (1.15228) and R2 (1.15795)
Stop Loss: at support levels S1 (1.15039) and S2 (1.14350)
This systematic approach helps traders plan trades confidently and manage risk efficiently.
Benefits of Using the PZ Pivot Points Indicator
Accurate Market Levels: Automatically calculates reliable support and resistance zones.
Multiple Calculation Methods: Choose from classic, camarilla, or woodie formulas.
Historical Backtesting: Evaluate past performance with historical pivot levels.
Customizable Interface: Change colors, line styles, and display options easily.
Multi-Timeframe Compatibility: Works seamlessly across all MT4 timeframes.
Conclusion
The PZ Pivot Points Indicator is an excellent tool for identifying support and resistance zones and improving your forex backtesting process. By using it, traders can clearly define trade entries, exits, and stop-loss levels—leading to more disciplined and profitable trading decisions.
If you’re serious about mastering price action and support-resistance trading, download the PZ Pivot Points Indicator today and enhance your trading strategy.
Visit IndicatorForest.com to explore more powerful MT4 and MT5 indicators for smart trading.
1 Download
Published:
Oct 31, 2025 13:07 PM
Category: