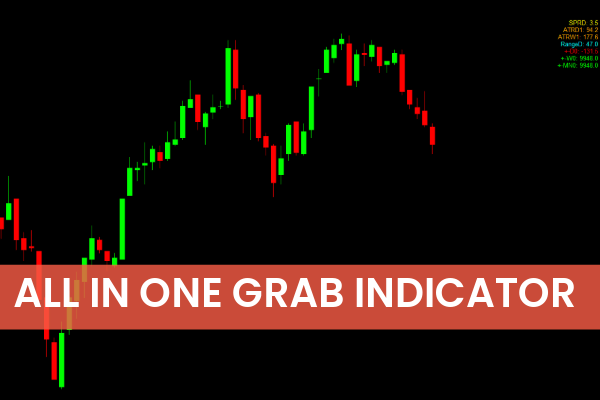
The All in One Grab Indicator for MetaTrader 4 (MT4) is an advanced, multi-functional trading tool designed to help Forex traders view key technical levels and market metrics in one glance. By combining several popular indicators into a single dashboard, it offers a clear, structured view of the market — ideal for traders who value precision and efficiency in technical analysis.
This versatile tool integrates elements from:
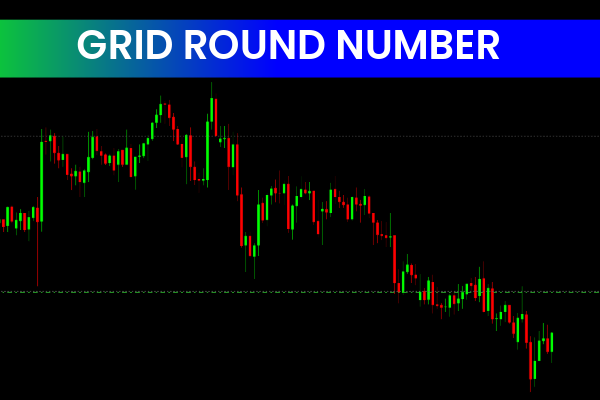
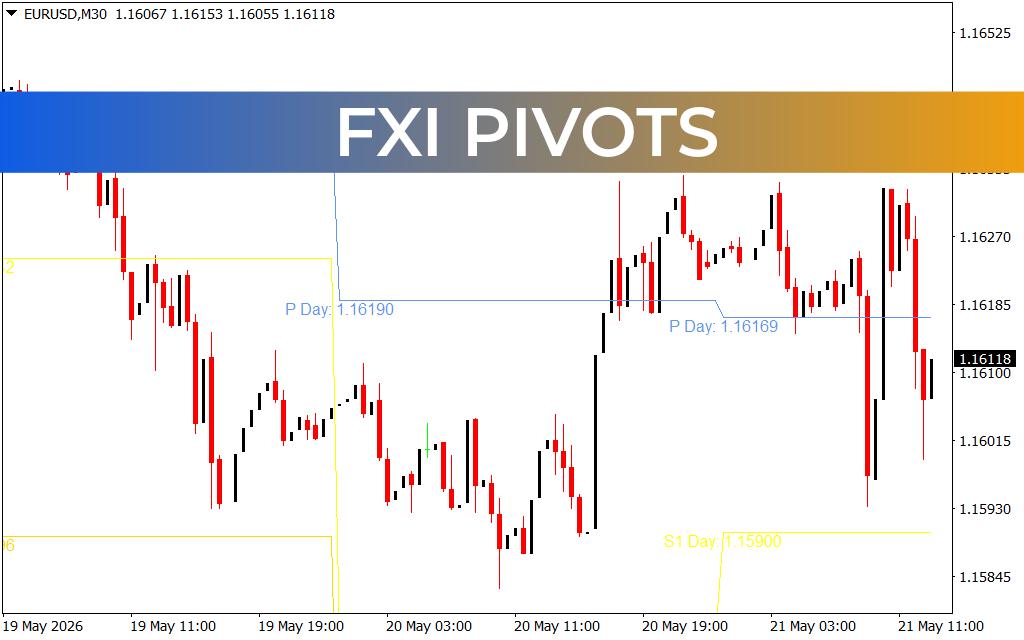
Pivot Zone Markers – Highlighting critical intraday and daily reversal points.
Moving Averages – Displaying dynamic trend direction and momentum.
Average Daily Range (ADR) – Measuring volatility and price exhaustion zones.
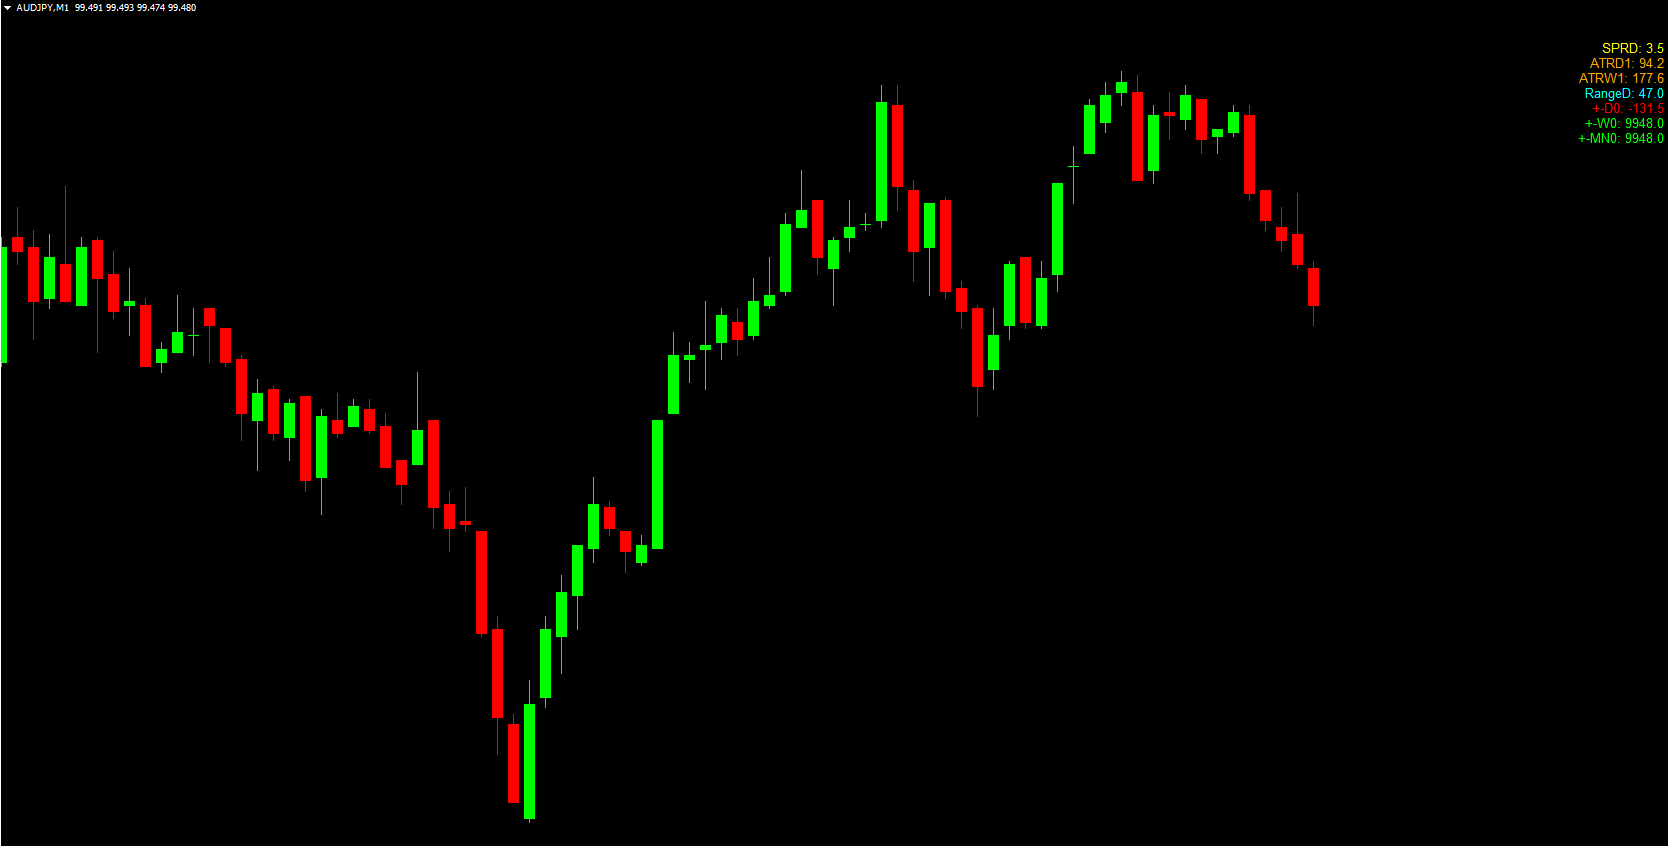
Spread Detector – Showing current market spread in real-time.
Support/Resistance Zones – Indicating key horizontal market barriers.
By consolidating these data points, the All in One Grab Indicator provides traders with a holistic view of Market Structure, volatility, and potential reversal or continuation zones — all within a single, uncluttered chart window.
How the All in One Grab Indicator Works
The All in One Grab Indicator acts as a comprehensive market map, plotting multiple analytical layers to help traders identify entry, exit, and risk zones efficiently.
Pivot Levels: These horizontal levels show possible reversal points for intraday and swing trades.
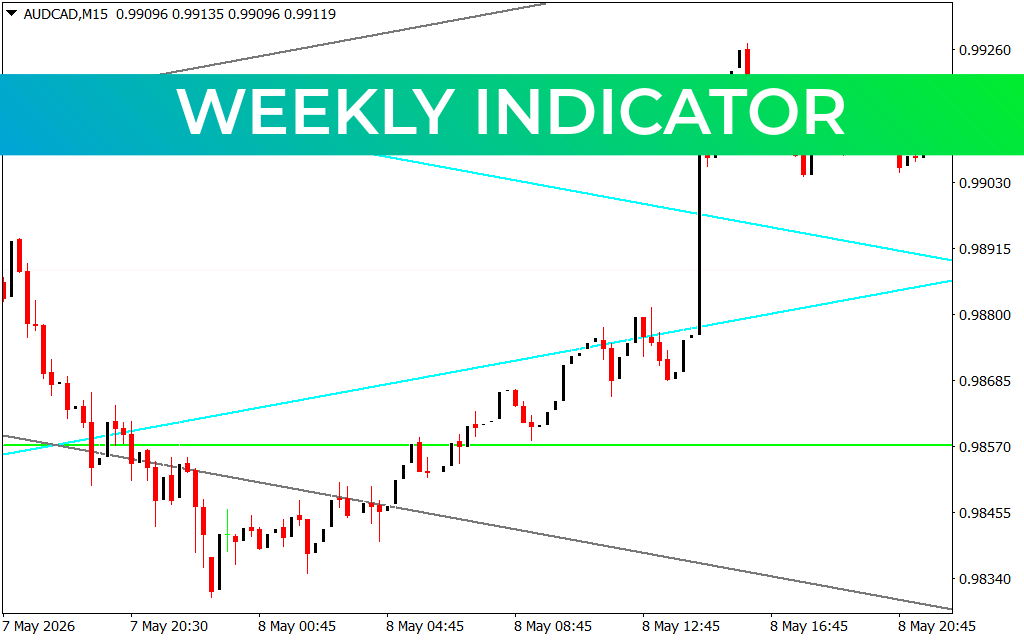
Support & Resistance Zones: The indicator automatically plots zones derived from daily, weekly, and monthly highs/lows.
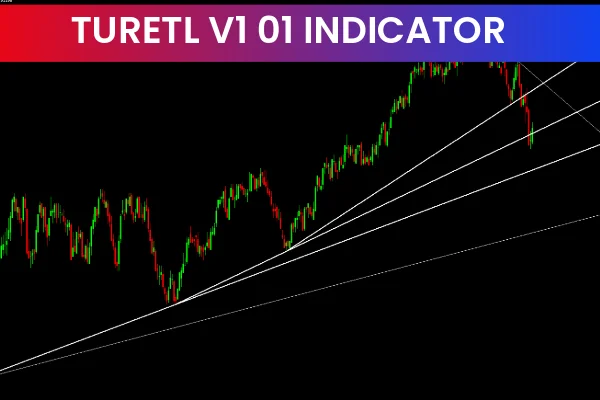
Moving Averages: Offer insight into current trend direction and potential dynamic support/resistance.
ADR (Average Daily Range): Displays the typical daily volatility range to estimate exhaustion levels or breakout potential.
Spread Display: Real-time spread data helps traders avoid entering trades during high-cost market conditions.
All these metrics are automatically calculated and presented with intuitive color-coding and labeled lines, making it easy to interpret at a glance.
How to Trade with the All in One Grab Indicator for MT4
Although the All in One Grab Indicator does not directly produce buy or sell arrows, it provides critical decision-making zones that can be integrated into your existing trading strategy.
Identifying Support and Resistance Levels
The indicator plots horizontal lines that represent key levels across different timeframes.
Blue or Green Lines: Support zones – potential buy or bounce areas.
Red or Orange Lines: Resistance zones – potential sell or reversal areas.
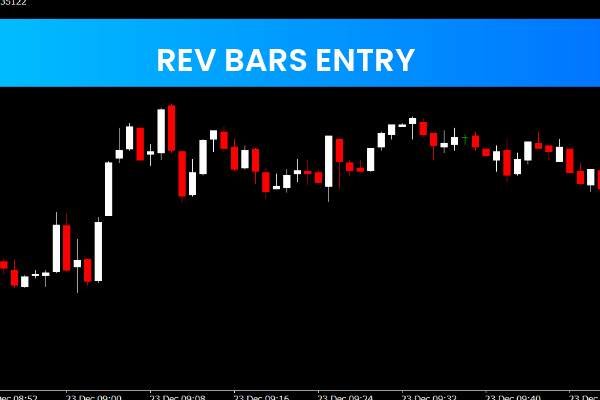
Buy Setup Example:
When price breaks above a resistance line (such as a daily pivot or previous high) and successfully retests it as new support, traders can enter a long position after a bullish confirmation candle (e.g., bullish engulfing or pin bar).
Sell Setup Example:
If price tests a strong resistance level and forms a bearish reversal candle, this may signal a short trade opportunity.
Using the ADR (Average Daily Range)
The ADR overlay helps traders determine when price has moved excessively for the day:
If price nears the upper ADR limit, expect a potential pullback or reversal.
If price approaches the lower ADR limit, prepare for a bounce or consolidation.
This feature is especially useful for day traders and scalpers, helping avoid entries when the daily move is already extended.
Incorporating Moving Averages
The indicator’s built-in moving averages can confirm the trend direction:
Upward-sloping MAs: Favor long positions.
Downward-sloping MAs: Favor short positions.
Combine this with the support/resistance levels for trend continuation trades or use divergence from these levels to spot trend exhaustion.
Leveraging Daily/Weekly Close Levels
The indicator marks the previous daily and weekly close lines — significant levels where price often reacts.
A break and retest of these levels often precedes a strong momentum move.
Watch for candlestick confirmations (engulfing bars, rejections) around these lines to validate entry signals.
Key Features of the All in One Grab Indicator
Feature
Description
Pivot Zone Marker
Displays intraday and higher timeframe pivot points.
Support/Resistance Zones
Identifies horizontal key levels automatically.
Moving Averages
Tracks short and long-term trend direction.
ADR Overlay
Shows average volatility and range exhaustion levels.
Spread Detector
Displays current market spread for cost efficiency.
Daily/Weekly Close Levels
Marks critical reversal or continuation zones.
Best Practices for Using the All in One Grab Indicator
Combine with Price Action: Use candlestick patterns or market structure breaks for confirmation.
Trade with the Trend: Follow moving average direction and pivot alignment.
Avoid Overtrading: When price is between major zones, wait for breakout confirmation.
Use ADR Wisely: Avoid new trades when the daily range is fully extended.
Filter with Volume or Momentum Indicators: Combine with RSI, MACD, or CCI for added precision.
Benefits of the All in One Grab Indicator
All-in-One Market Overview – Combines multiple analytical tools in a single interface.
Time-Saving Tool – Eliminates the need for switching between indicators or timeframes.
Dynamic and Intuitive Display – Clear visual differentiation of trend zones and levels.
Multi-Timeframe Support – Analyzes daily, weekly, and intraday levels simultaneously.
Ideal for All Trading Styles – Effective for Scalping, swing trading, and long-term analysis.
Free Download – Simple installation and compatible with all MT4 brokers.
Conclusion
The All in One Grab Indicator for MT4 is an innovative and practical market insight tool designed for traders who want a complete technical overview on one chart. By integrating pivots, ADR, moving averages, and horizontal support/resistance zones, it simplifies the trading process and enhances decision-making.
While it does not produce direct buy/sell arrows, its powerful visualization of market structure and trend zones allows traders to identify high-probability entries, exits, and reversals with confidence.
👉 Download the All in One Grab Indicator for MT4 for free from IndicatorForest.com and experience the convenience of multi-indicator trading in a single tool.
FAQ
2 Downloads
Last Update:
Nov 07, 2025 04:42 AM
Published:
Nov 07, 2025 04:32 AM
Category: