The SHI Channel True Indicator for MT5 is a powerful technical analysis tool that helps traders visualize price movement within a channel. It uses a fractal-based algorithm to automatically plot three lines on the chart — an upper channel, lower channel, and a dotted middle line.
These lines represent dynamic support and resistance levels, helping traders identify the prevailing trend, spot potential reversals, and confirm breakout trading opportunities. The indicator is ideal for traders who rely on Price Action and trend-following strategies in the forex market.
How the SHI Channel True Indicator Works
The SHI Channel True Indicator identifies fractal points — local highs and lows formed by price movements — and connects them to form upper and lower boundaries of the price channel.
Upper Channel Line: Formed by connecting recent significant highs (fractals).
Lower Channel Line: Formed by connecting recent significant lows.
Middle Line: A dotted line between the upper and lower boundaries, serving as a trend reference point.
The indicator continuously updates as new fractal points appear, giving traders a real-time visual of the market’s trend direction and momentum strength.
How to Use the SHI Channel True Indicator for MT5
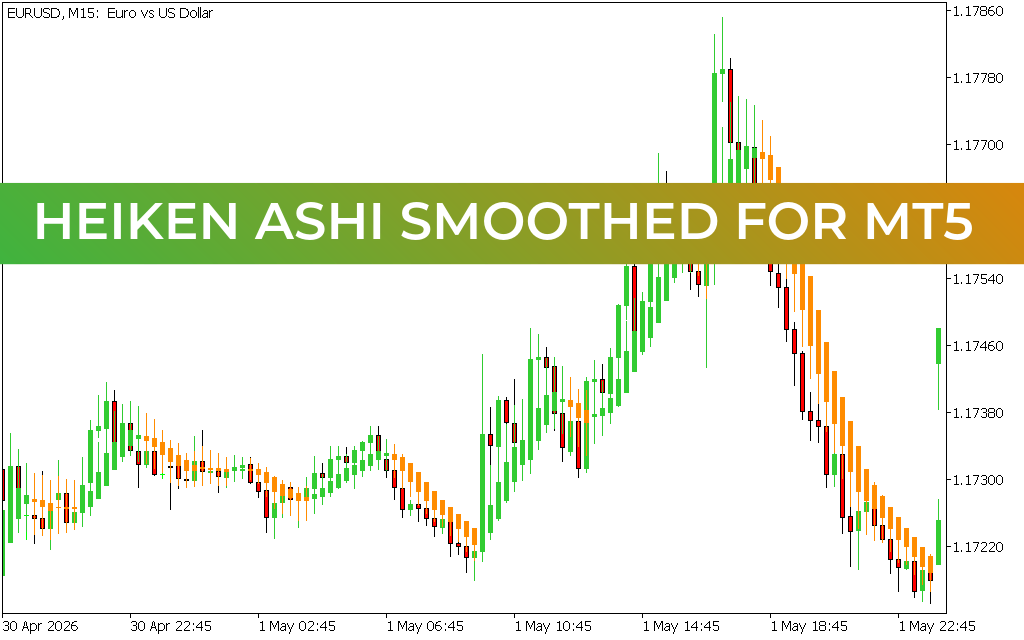
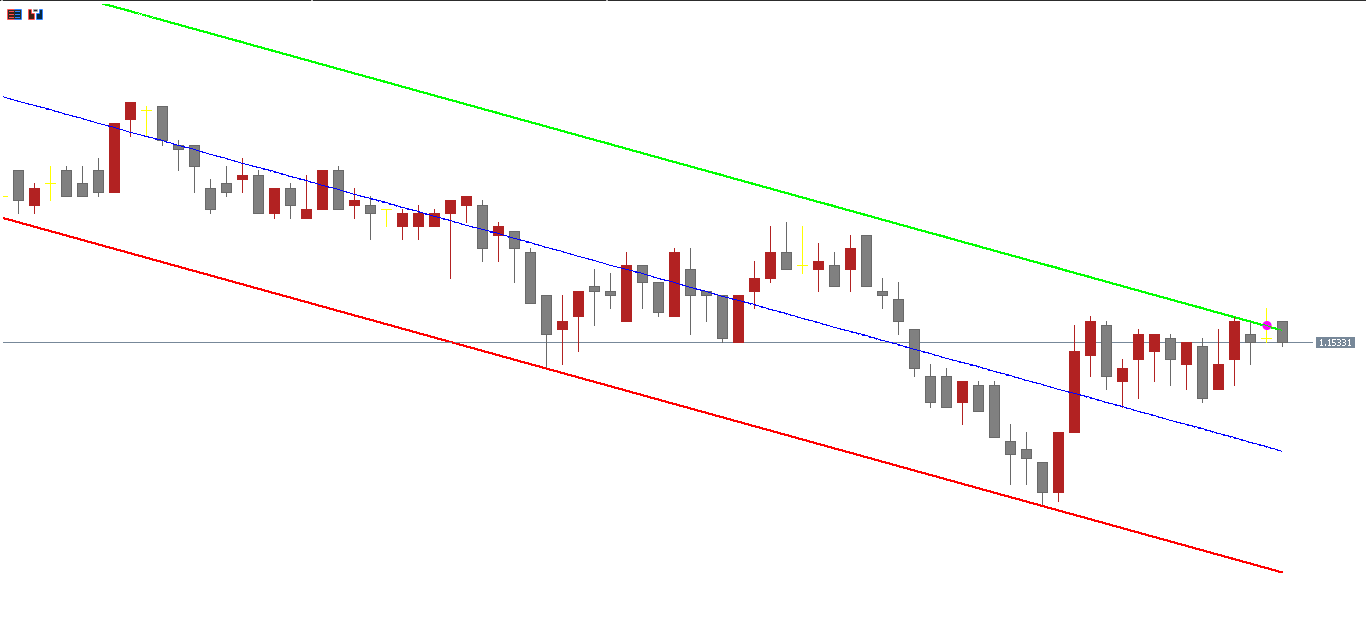
The image above shows the GBP/USD H1 chart with the SHI Channel True Indicator applied. Traders can analyze the slope, direction, and structure of the channel to interpret market behavior.
Identify Trend Direction
An upward-sloping channel indicates a bullish trend.
A downward-sloping channel signals a bearish trend.
A sideways channel suggests range-bound conditions or consolidation.
Trade Breakouts
A break above the upper channel line signals potential bullish breakout opportunities.
A break below the lower line indicates a possible bearish breakout.
Traders can open positions in the direction of the breakout once confirmed by additional indicators such as volume, RSI, or MACD.
Use the Middle Line as a Guide
The dotted middle line acts as a dynamic equilibrium level — a zone where price may temporarily pull back or reverse before continuing the main trend.
For example:
In an uptrend, price rebounding from the middle line offers potential buy entries.
In a downtrend, rejection from the middle line can indicate a sell setup.
Trading Tips for Better Accuracy
While the SHI Channel True Indicator provides valuable insights, it works best when used alongside other confirmation tools. Consider combining it with:
Momentum indicators (RSI, MACD) for confirmation of Trend Strength.
Candlestick Patterns for reversal confirmation.
Volume indicators to validate breakout strength.
Avoid trading during low volatility or choppy market conditions, as false breakouts can occur.
Key Benefits of the SHI Channel True Indicator
Automatically draws dynamic Support And Resistance zones.
Helps identify trend direction and strength.
Useful for breakout, trend-following, and reversal trading.
Works across all timeframes and currency pairs.
Suitable for both beginners and professional traders.
How to Download and Install the SHI Channel True Indicator for MT5
You can download the SHI Channel True Indicator for MT5 for free and install it easily:
Download the indicator file (.mq5 or .ex5).
Place it in the Indicators folder inside the MQL5 directory of your MetaTrader 5.
Restart MT5 and add the indicator to your chart from the Navigator panel.
Once attached, customize the input settings to adjust sensitivity, color, and line styles to suit your trading strategy.
Conclusion
The SHI Channel True Indicator for MT5 is a valuable tool for traders seeking to understand Market Structure and identify potential breakout zones. By using a fractal-based strategy, it effectively highlights dynamic price channels, helping traders anticipate market reversals and continuation signals.
When combined with additional technical tools, the SHI Channel True Indicator becomes a reliable companion for forex traders looking to refine their trend analysis and entry timing.
FAQ
8 Downloads
Published:
Nov 07, 2025 01:49 AM
Category: