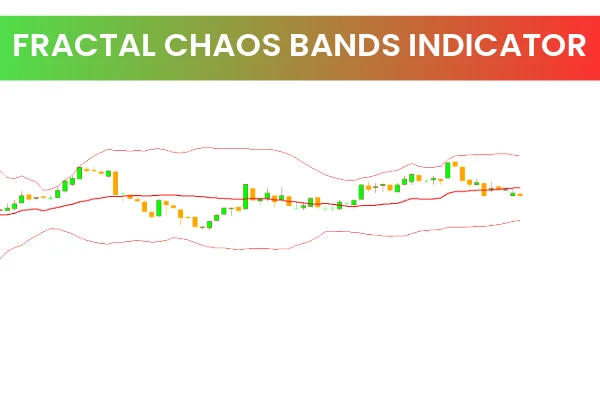
The Fractal Chaos Bands Indicator for MetaTrader 4 (MT4) is a powerful technical analysis tool that applies fractal geometry to study market behavior. It creates upper and lower bands around price movements, allowing traders to observe volatility, identify potential breakout zones, and anticipate trend reversals.
Unlike traditional moving average or volatility indicators, the Fractal Chaos Bands Indicator is based on fractal mathematics, which captures the self-repeating patterns found in Price Action. These patterns can reveal the natural rhythm of the market, helping traders understand whether the market is calm and consolidating or active and trending.
The indicator is suitable for all trading styles, from short-term scalping to long-term investing, and works across different asset classes such as forex, commodities, indices, and cryptocurrencies.
How the Fractal Chaos Bands Indicator Works
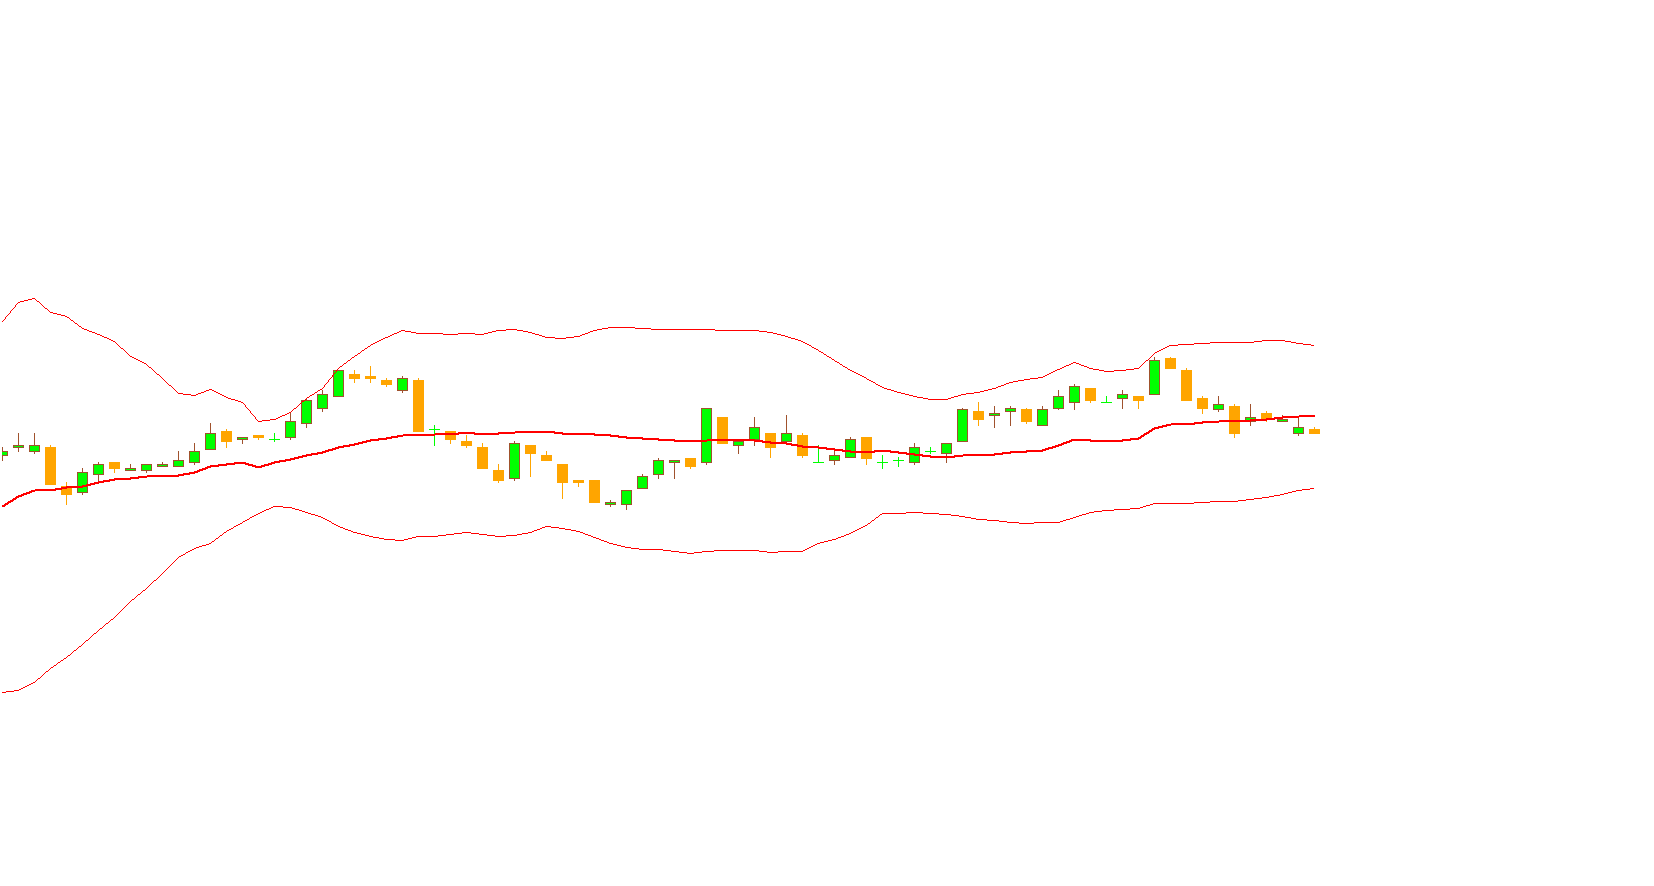
The Fractal Chaos Bands Indicator uses historical price data to calculate and plot two bands:
Upper Band: Represents potential resistance or overbought levels.
Lower Band: Represents potential support or oversold levels.
These bands are generated based on the fractal structure of the market, meaning that the indicator adapts dynamically as price volatility increases or decreases.
When the market is stable, the bands stay close together, reflecting low volatility. When the market becomes volatile, the bands expand, indicating strong price movements and potential breakout opportunities.
Fractal Chaos Bands Trading Signals
The Fractal Chaos Bands Indicator does not issue direct buy or sell signals. Instead, it provides visual guidance to help traders interpret market conditions and make informed trading decisions.
Price Touches or Crosses the Upper Band
Indicates that the market may be overbought.
Can signal either a reversal (if the price fails to break higher) or a continuation of a strong bullish trend (if the breakout holds).
Traders may consider taking profits on long positions or watching for short entry setups when confirmed by other indicators.
Price Touches or Crosses the Lower Band
Suggests that the market may be oversold.
Could indicate a potential reversal upward or a continuation of a bearish move if momentum persists.
Traders may prepare for buy opportunities if confirmed by additional analysis such as candlestick patterns or oscillators.
Price Staying Within the Bands
Indicates market stability and a possible range-bound phase.
Breakouts beyond the bands typically suggest an increase in volatility or the start of a new trend.
By combining this indicator with other tools such as Moving Averages, RSI, or MACD, traders can confirm signals and improve accuracy in identifying entry and exit points.
Advantages of Using the Fractal Chaos Bands Indicator
The Fractal Chaos Bands Indicator offers several benefits that make it a valuable addition to any trader’s toolkit:
Fractal-Based Volatility Analysis: Uses mathematical fractals to understand real market dynamics.
Adaptive to Market Conditions: Automatically expands or contracts with volatility changes.
Effective for Multiple Strategies: Works well for both trend-following and range-trading strategies.
Non-Lagging Visualization: Provides real-time insights without heavy lag like some moving average indicators.
Easy to Interpret: Offers a clean, visual representation of price boundaries and breakout potential.
Because it adapts to price behavior, this indicator is particularly helpful for traders who prefer dynamic trading tools that reflect actual market rhythm.
How to Trade with the Fractal Chaos Bands Indicator
Here’s a simple strategy example:
Identify Market Conditions: Observe whether price is trending or ranging.
Watch for Band Interaction:
If price consistently touches the upper band during an uptrend, it confirms strong bullish momentum.
If price frequently touches the lower band, it indicates persistent bearish pressure.
Wait for Confirmations: Combine the Fractal Chaos Bands with oscillators like RSI or Stochastic to validate potential reversals or continuation signals.
Manage Risk: Always use stop losses just beyond the opposite band to manage volatility-related breakouts.
Conclusion
The Fractal Chaos Bands Indicator for MT4 offers a unique, fractal-based approach to analyzing market trends and volatility. By displaying adaptive upper and lower price bands, it enables traders to spot potential breakout zones, identify overbought/oversold conditions, and anticipate reversals with precision.
Its versatility makes it an excellent choice for both new and experienced traders seeking a deeper understanding of Market Structure and dynamics.
Download the Fractal Chaos Bands Indicator for MT4 today from IndicatorForest.com to enhance your trading strategy with fractal-based market insights.
FAQ
8 Downloads
Published:
Nov 07, 2025 01:49 AM
Category: