Unlock Market Structure with the Octaves Indicator
In the complex world of Forex trading, identifying the "hidden" levels where price is likely to pause or reverse is the holy grail for many traders. Static Support And Resistance lines are helpful, but they often fail to account for the dynamic, rhythmic nature of market price action. The Octaves Indicator is a sophisticated technical tool designed to map the market's natural oscillation, providing a structured grid of levels that guide your entries, exits, and risk management.
Understanding the Octaves Concept
The Octaves indicator is based on the theory that financial markets often move in rhythmic, predictable cycles. Much like music or mathematical waves, price tends to gravitate toward specific levels—often referred to as "octaves"—that act as psychological and technical magnets.
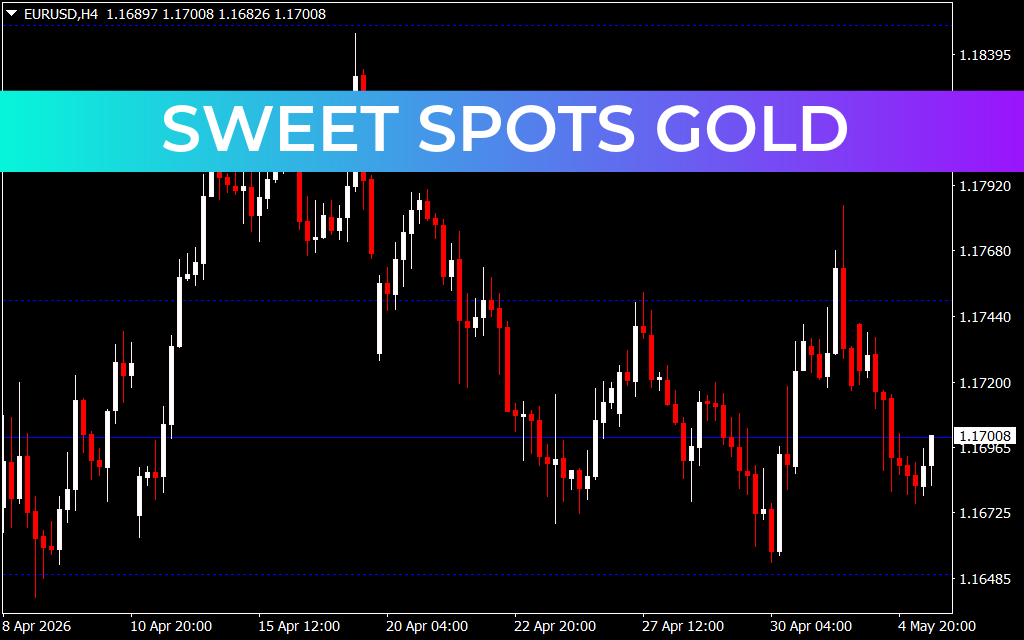
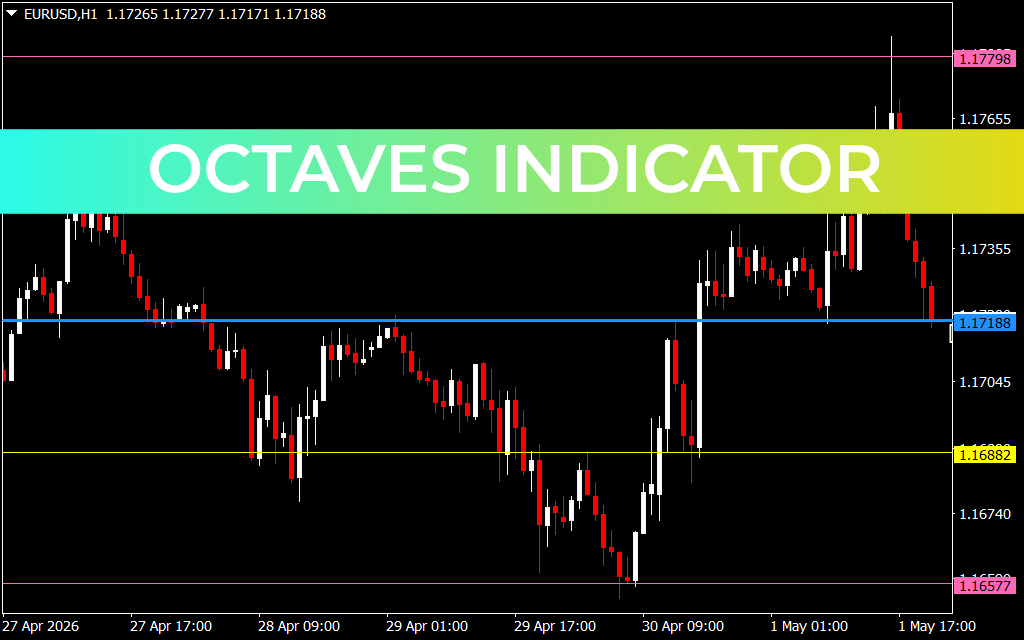
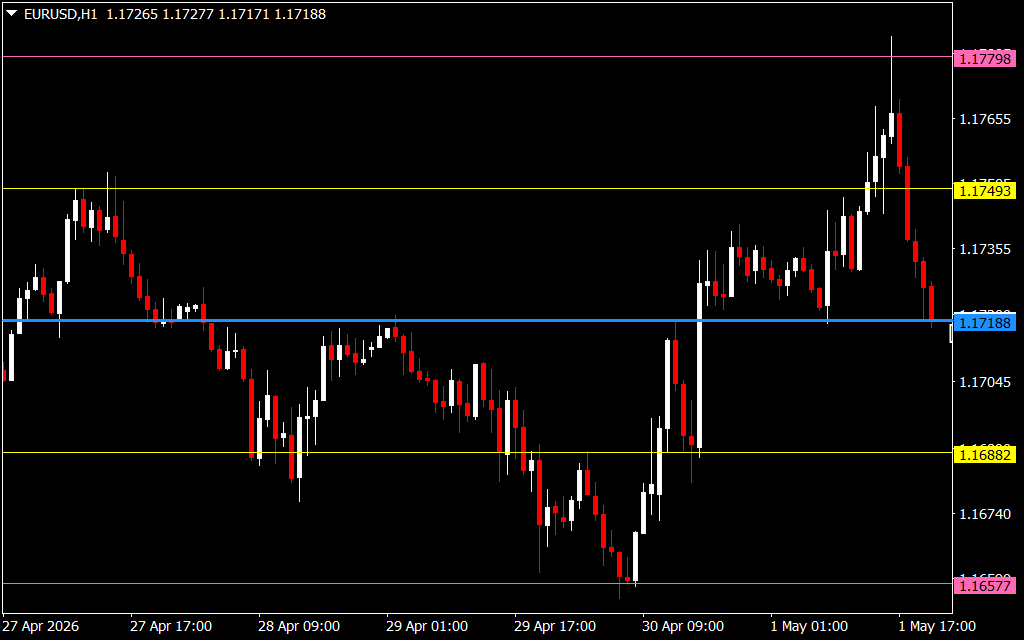
As seen on your EUR/USD H1 chart, the indicator generates a series of horizontal lines. These lines are not arbitrary; they represent zones where Supply And Demand have historically intersected. When price hits an "octave," it often struggles to break through, or conversely, it experiences a sharp rejection.
Why Every Professional Trader Needs Octaves
The primary challenge for most traders is indecision—not knowing where to place a take-profit or where a trend might realistically end. The Octaves indicator solves this by offering:
- Logical Profit Targets: By plotting potential "next stops" for price, the indicator tells you exactly where to secure your gains. If you are long and price approaches the next blue or yellow octave line, it is a logical place to consider scaling out of your position.
- Defined Risk Zones: Octave levels act as natural stop-loss markers. Placing your stop just behind a strong octave line ensures that you are only in the trade while your thesis remains valid.
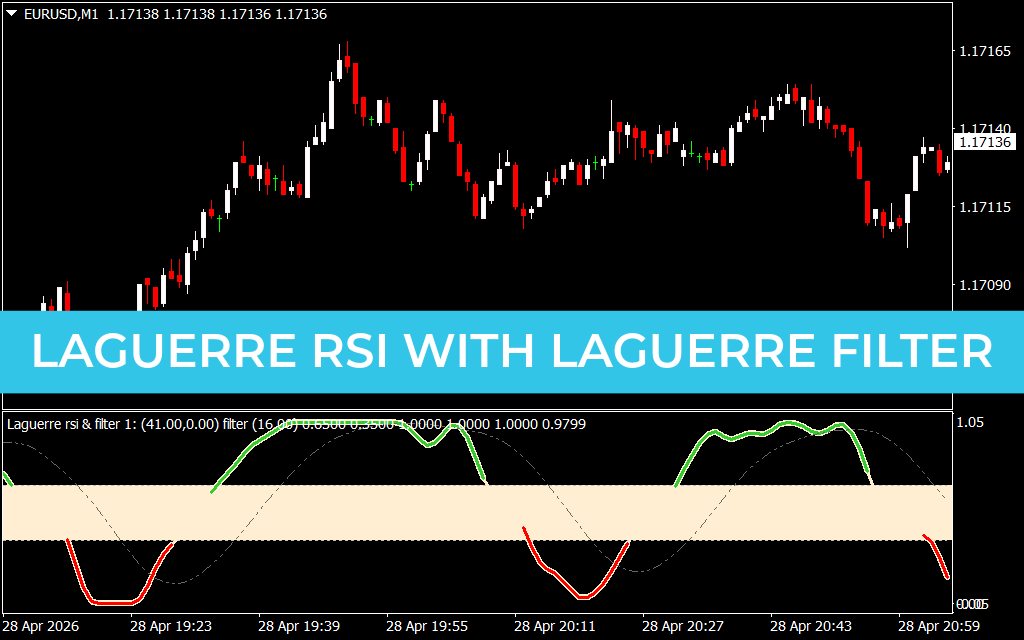
- Confluence and Clarity: Used alongside other indicators (like the trend-following tools visible on your M1 chart), Octaves provide the "anchor" for your strategy. It provides the where, while your other tools provide the when.
Strategic Implementation
To maximize the value of the Octaves indicator, integrate it into your daily workflow:
- The Breakout Play: When price breaks decisively through an octave line, it often accelerates toward the next level. Traders use this as a signal for high-momentum breakout trades.
- Mean Reversion: When price hits an extreme octave level and shows signs of exhaustion (such as a pin bar or engulfing candle), it provides a low-risk opportunity to trade back toward the median level.
- Multi-Timeframe Sync: Always check the Octave levels on the H1 or H4 charts to get the "big picture" of major barriers. Use these major levels to guide your smaller-scale trades on the M1 or M5 timeframes, ensuring your scalps aren't running directly into a major brick wall.
The Octaves indicator transforms a cluttered, confusing chart into a structured environment. It allows you to see the market not as random noise, but as a series of levels and zones, giving you the confidence to execute trades with precision and professional discipline.
4 Downloads
Last Update:
May 02, 2026 13:49 PM
Published:
Jan 29, 2026 17:46 PM
Category: