Mastering Mean Reversion with the VWAP Oscillator Indicator
In the institutional trading world of 2026, volume is the only true footprint left by the "smart money." While standard moving averages only account for price, the VWAP Oscillator (Volume Weighted Average Price) incorporates volume data to provide a much more accurate representation of true market value. This indicator is a professional-grade utility designed for MetaTrader that helps traders identify when an asset like EUR/NZD is overextended and likely to return to its fundamental equilibrium.
The Science of Volume-Weighted Value
The standard VWAP is a single line on a chart that represents the average price an instrument has traded at throughout the day, based on both volume and price. The VWAP Oscillator takes this a step further by transforming that relationship into a dynamic oscillator in a sub-window. This allows traders to see the distance between the current price and the volume-weighted average, providing a clearer picture of whether a market is "cheap" or "expensive" relative to the day's total trading activity.
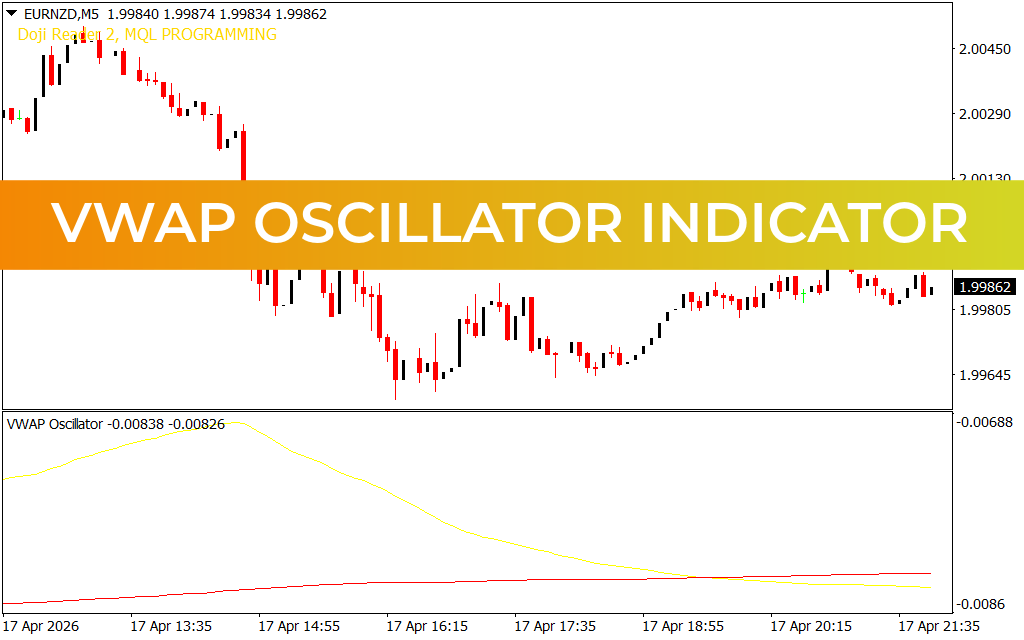
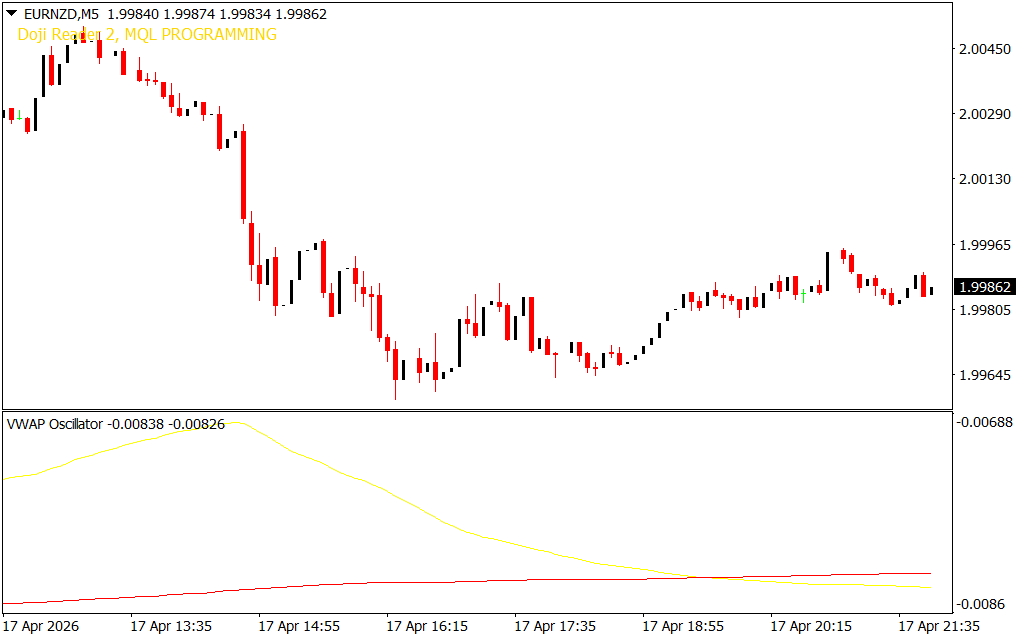
As demonstrated in the EUR/NZD 5-minute (M5) chart, the oscillator utilizes two primary components:
- The Yellow Signal Line: Tracks the real-time deviation of price from the VWAP.
- The Red Baseline: Represents the "mean" or the zero-point where price and volume are in perfect balance.
Identifying High-Probability Reversal Zones
For day traders and scalpers, the VWAP Oscillator is the ultimate mean-reversion tool. Markets spend the majority of their time oscillating around the VWAP. When the yellow line moves significantly away from the red baseline, it indicates a state of market imbalance.
- Overbought Signals: When the yellow line peaks high above the red baseline, the market is overextended to the upside. This suggests that buyers are exhausted and a "snap-back" to the mean is imminent.
- Oversold Signals: When the yellow line dips deep below the red baseline, the market is oversold. Value-seeking institutional buyers often enter at these levels to push the price back toward the average.
Enhancing Your Scalping Precision
On lower timeframes like the M5, the VWAP Oscillator acts as a powerful "filter" for trend-following strategies. If your primary Trend Indicator says "buy," but the VWAP Oscillator shows the yellow line is already at an extreme peak, it warns you that you are buying at the top. By waiting for the oscillator to return toward the red baseline before entering, you significantly improve your risk-to-reward ratio.
Professional Design for Modern Charts
Visual clarity is a priority for serious traders. The VWAP Oscillator is designed with minimalist aesthetics, ensuring it doesn't clutter your workspace. Whether you are using a professional dark mode setup or a clean white background, the high-contrast yellow and red lines provide instant data interpretation. This allows for split-second execution during high-volume periods like the London-New York crossover.
By integrating the VWAP Oscillator into your trading suite, you are no longer just guessing where the price might go—you are following the mathematical reality of volume and value. Transform your approach to mean reversion and start trading with the precision of institutional algorithms today.
2 Downloads
Last Update:
Apr 19, 2026 21:43 PM
Published:
Feb 03, 2026 19:30 PM
Category: