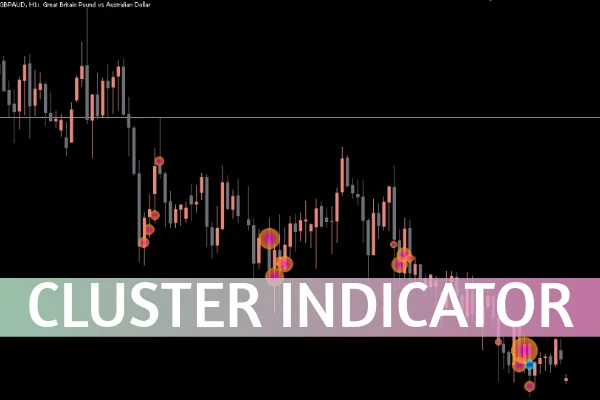
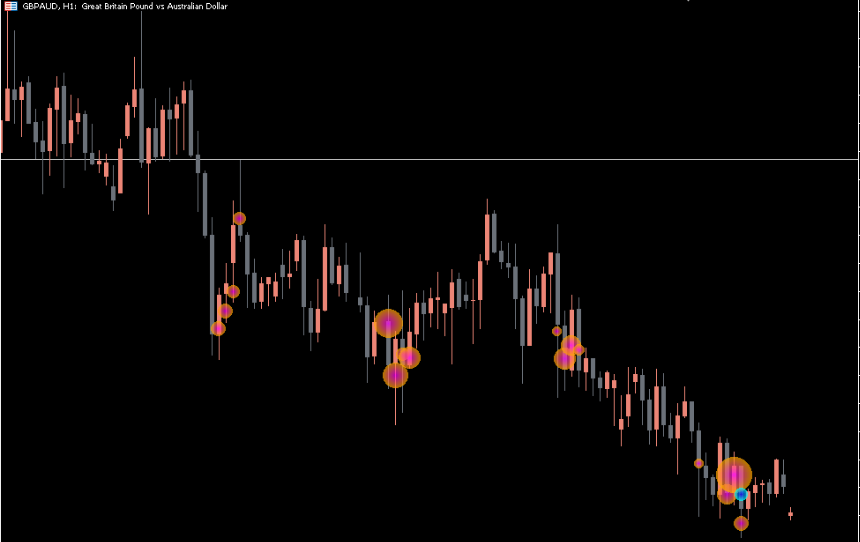
The Cluster Indicator for MetaTrader 5 (MT5) is a powerful analytical tool that helps traders visualize high-volume trading zones directly on their charts. Unlike traditional price-based indicators, the Cluster Indicator focuses on tick volume distribution, allowing traders to detect accumulation, distribution, and breakout areas with precision. By plotting colorful, dynamic circles on key price levels, this tool provides a visual map of where the most significant trading activity occurs — giving you an edge in identifying institutional interest zones.
How the Cluster Indicator Works
The Cluster Indicator MT5 measures tick volume within a specific price range and time period. It then highlights these areas with vibrant clusters — the larger and more colorful the circle, the higher the trading activity.
This method enables traders to pinpoint:
High-volume zones that may serve as future support or resistance levels
Areas of accumulation or distribution, often preceding major market moves
Potential breakout points, where strong buying or selling interest emerges
Unlike oscillators or moving averages, the Cluster Indicator doesn’t lag behind price. Instead, it delivers real-time insights into where the market participants are most active, reflecting true trading pressure in the moment.
Cluster Indicator Trading Signals
The Cluster Indicator doesn’t produce buy or sell arrows but rather helps traders interpret Market Structure through volume intensity. For example:
When a large cluster appears near the top of an uptrend, it might signal distribution — a potential price reversal.
When clusters form around the bottom of a downtrend, it could indicate accumulation, suggesting a bullish reversal may be near.
A breakout above or below a dense cluster area can signal the start of a new price trend.
By reading these patterns, traders can align their entries and exits with actual market behavior instead of relying solely on indicators derived from past price data.
Key Features of the Cluster Indicator MT5
Real-Time Volume Visualization
The indicator dynamically updates cluster positions as the market moves, ensuring traders always see the latest volume concentrations.
Customizable Parameters
Users can adjust the number of days, price range, and tick volume sensitivity to match their specific trading strategies — from Scalping to swing trading.
Support for Multiple Timeframes
The Cluster Indicator works across all timeframes in MT5, making it suitable for intraday analysis and long-term market observation alike.
Easy Market Interpretation
With its color-coded visual design, even beginner traders can quickly grasp where key market activity is concentrated without complex analysis.
Benefits of Using the Cluster Indicator
Identify institutional trading zones with precision
Enhance risk management by trading near strong support or resistance
Spot accumulation and distribution phases early
Combine with Price Action or other volume indicators for stronger confirmations
By focusing on where trading activity is occurring — not just how price moves — the Cluster Indicator helps traders trade smarter and with greater confidence.
How to Use the Cluster Indicator on MT5
Install the indicator on your MT5 platform.
Open your desired chart and select the timeframe for analysis.
Adjust the cluster sensitivity and period settings according to your strategy.
Observe the colored volume circles forming at key price levels.
Use these zones to plan entries, exits, or confirmations of existing trades.
Conclusion
The Cluster Indicator MT5 is an indispensable tool for traders who prioritize volume dynamics in their decision-making. By offering a clear visualization of tick volume concentration, it reveals hidden zones of buying and selling pressure that often precede major market movements. Whether you’re scalping or performing in-depth intraday analysis, the Cluster Indicator gives you a clear advantage in understanding market sentiment.
To download and learn more about the Cluster Indicator MT5, visit IndicatorForest.com — your trusted source for high-quality trading tools and expert guides.
36 Downloads
Published:
Oct 27, 2025 22:38 PM
Category: