The Camarilla Indicator for MetaTrader 4 (MT4) is a dynamic pivot-based trading tool that automatically calculates and displays Camarilla pivot points, standard pivots, and mid-pivot levels. It helps traders quickly identify areas of Support And Resistance, making it a powerful tool for breakout, reversal, and intraday strategies.
Derived from the previous day’s price data (high, low, and close), the Camarilla indicator gives traders a structured view of the market, allowing them to anticipate key turning points or continuation zones. The inclusion of optional Fibonacci levels further enhances precision for traders who rely on confluence zones.
Why Use the Camarilla Indicator?
Manually calculating and plotting pivot levels can be time-consuming and prone to human error. The Camarilla Indicator simplifies this process by automatically updating the levels for each new trading day.
Key Benefits:
Automatic Pivot Calculation: Uses previous day’s data to plot support, resistance, and breakout targets.
Visual Clarity: Displays clear red and green lines for easy identification of support and resistance zones.
Multi-Timeframe Compatibility: Works across all timeframes — from M1 Scalping charts to long-term daily or weekly Setups.
Built-In Fibo Lines: Option to enable Fibonacci levels for confluence-based trading.
Entry and Target Levels: Highlights ideal breakout entry points and profit targets.
This makes it particularly useful for pivot traders, breakout traders, and scalpers who want to identify price reaction zones quickly and accurately.
How the Camarilla Indicator Works
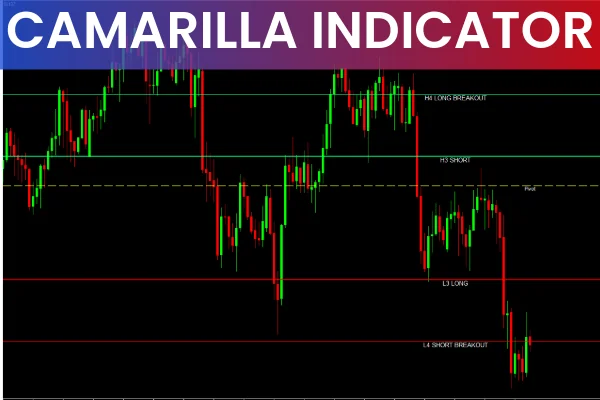
The Camarilla indicator divides the trading range from the previous session into multiple levels of support (S) and resistance (R).
Green lines mark resistance zones (R1, R2, R3, etc.).
Red lines represent support zones (S1, S2, S3, etc.).
Each level acts as a potential pivot zone where price may reverse or continue its movement, depending on market momentum and volume.
For breakout trading, the indicator highlights special breakout levels — such as LONG BREAKOUT (LB) and SHORT BREAKOUT (SB) — along with their respective target lines (LB TARGET and SB TARGET).
Trading Signals Using the Camarilla Indicator
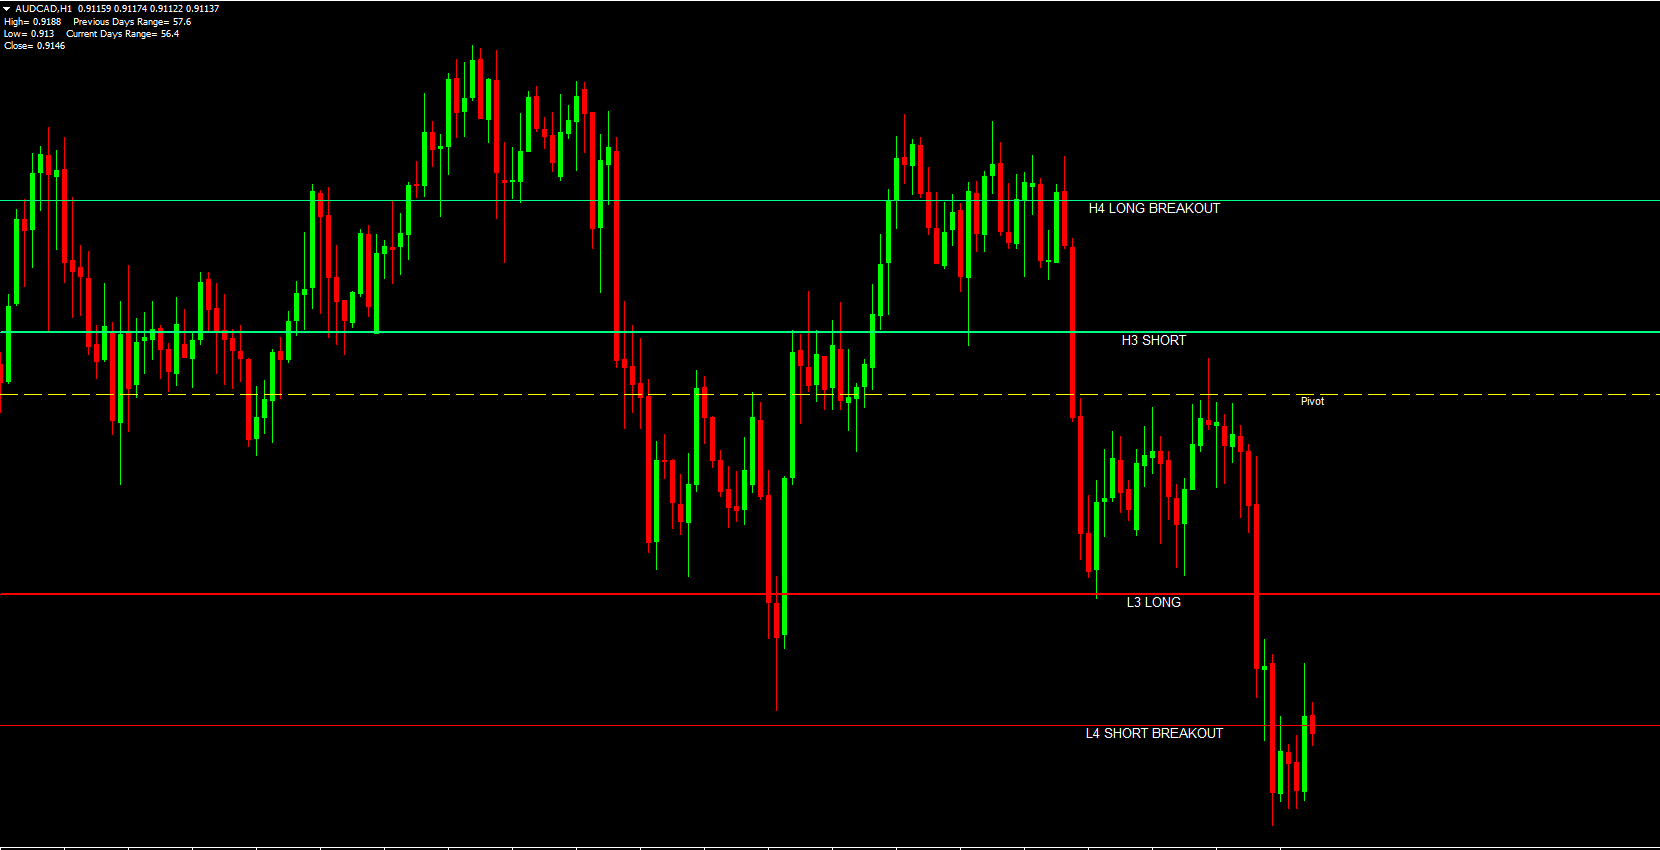
The chart example above (GBPAUD H1) demonstrates how the Camarilla Indicator functions in real time.
Buy Signal
When price reaches the BUY line or breaks above the LONG BREAKOUT line, it suggests strong bullish momentum. Traders can:
Enter a BUY/LONG position.
Target the LB TARGET line for potential profit.
Sell Signal
If price hits the SHORT line or drops below the SHORT BREAKOUT line, it indicates growing bearish pressure. Traders can:
Enter a SELL/SHORT position.
Aim for the SB TARGET line as a profit target.
Range Trading
When price oscillates between support and resistance levels without breaking out, traders can look for reversal opportunities using Price Action signals (like pin bars or engulfing candles) near pivot zones.
Best Practices
Combine the indicator with price action and candlestick analysis for confirmation.
Use RSI, MACD, or Volume indicators to validate breakout strength.
For intraday traders, focus on H1 and M15 charts, while swing traders can use H4 or Daily for stronger pivots.
Conclusion
The Camarilla Indicator for MT4 simplifies pivot trading by automatically plotting precise support, resistance, and breakout levels. With its built-in targets and optional Fibonacci overlays, it provides traders with a structured, data-driven approach to identifying potential entry and exit zones.
Whether you’re a scalper, day trader, or swing trader, this indicator brings clarity and accuracy to your charting — making it an essential tool for anyone who trades using price levels.
Download the Camarilla Indicator for MT4 today from IndicatorForest.com and take the guesswork out of pivot-based trading.
FAQ
5 Downloads
Published:
Nov 08, 2025 23:53 PM
Category: