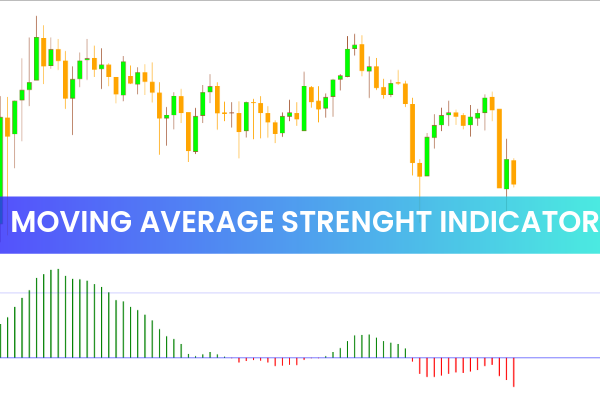
The Moving Average Strength Indicator for MT4 is a powerful technical analysis tool that measures the strength and momentum of a financial asset. Using momentum detectors like Moving Averages, MACD, and Stochastic, it provides traders with a visual representation of bullish or bearish pressure through color-coded histogram bars.
When the indicator displays green bars above the zero line, it indicates positive market strength, suggesting bullish momentum and potential buying pressure. Conversely, red bars below the zero line highlight negative strength, implying bearish pressure and potential selling momentum.
However, while these readings show market strength, they should not be used as direct buy or sell signals. Instead, traders should combine the indicator with Price Action strategies or other technical tools to identify optimal entry points.
How the Moving Average Strength Indicator Works
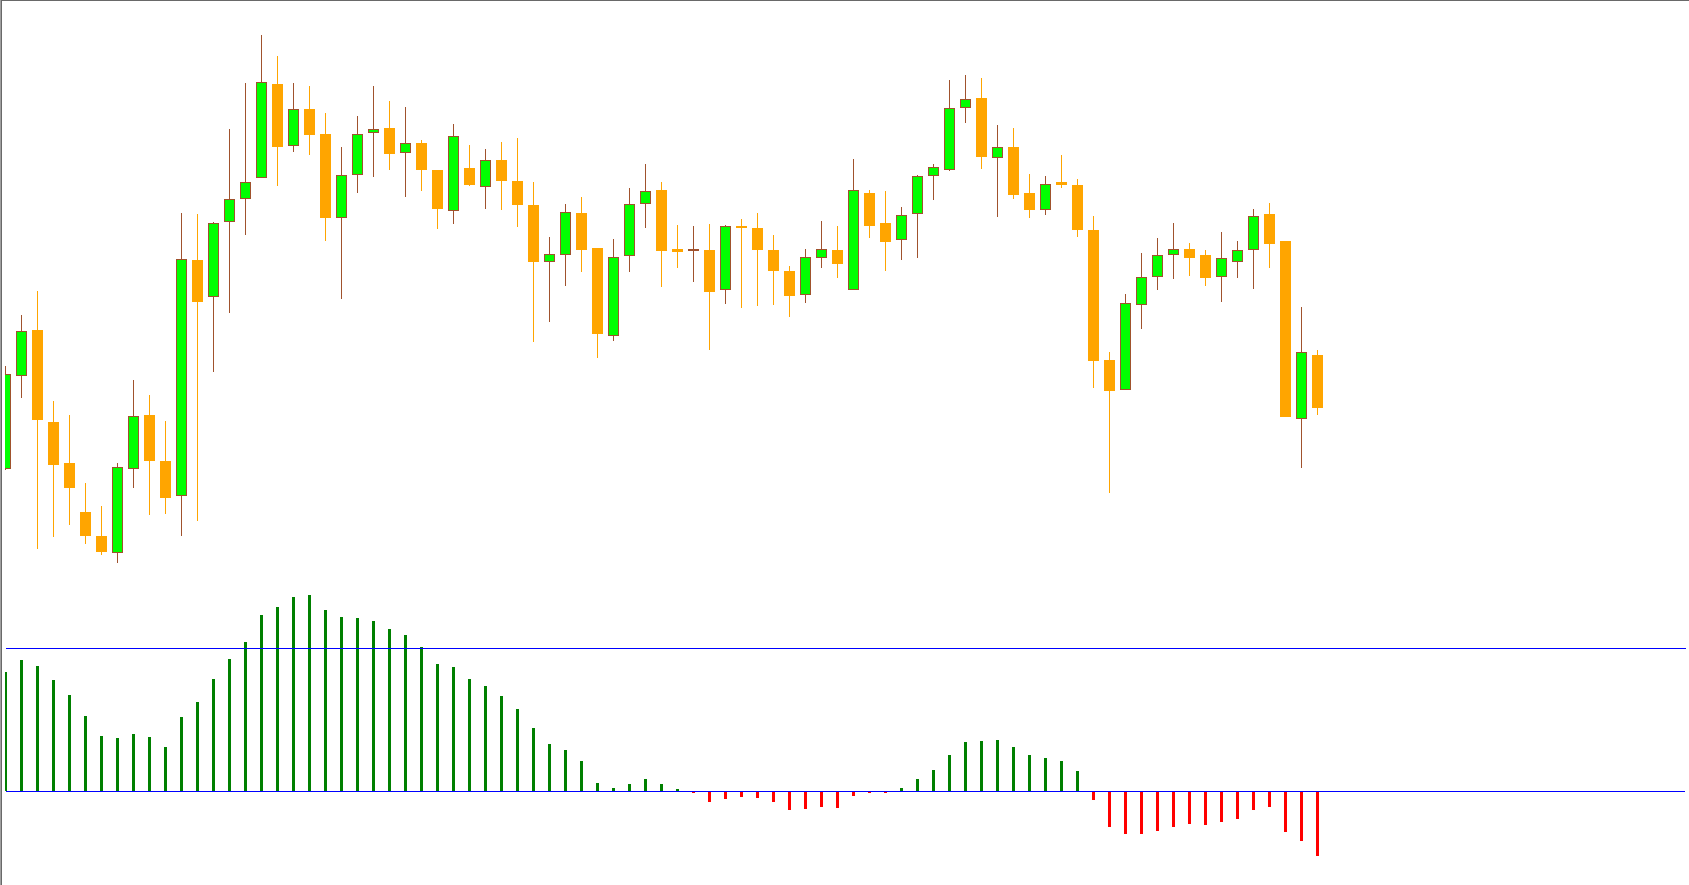
At its core, the Moving Average Strength Indicator calculates the rate of change between moving averages and converts it into a visual histogram.
Green Histogram Bars: Represent bullish momentum (positive strength).
Red Histogram Bars: Represent bearish momentum (negative strength).
Zero Line: The midpoint where momentum shifts from bullish to bearish or vice versa.
By gauging whether market momentum is increasing or fading, traders can make more informed decisions about when to enter or exit a trade.
Best Market Conditions for Using the Indicator
This indicator performs best in trending markets, where momentum and price direction are clear. In sideways or choppy conditions, the readings can produce false signals. To enhance accuracy, traders can combine it with other indicators such as:
Moving Average Convergence Divergence (MACD)
Relative Strength Index (RSI)
Support And Resistance Levels
Price Action Patterns
Using the Moving Average Strength Indicator alongside these tools helps confirm trend strength and improves trade reliability.
How to Trade with the Moving Average Strength Indicator
Let’s look at an example using the EUR/USD pair on a 30-minute chart (M30):
Identify the Trend: The indicator shows red histogram bars below the zero line, confirming a bearish trend.
Check Strength Levels: The moving average value remains negative, suggesting strong bearish pressure.
Confirm with Price Action: Wait for the price to retest a resistance or supply zone.
Execute the Trade: When a bearish candle forms at the resistance level, it signals a sell entry confirmation.
This combination of momentum and price action offers a higher-probability trading setup.
Advantages of the Moving Average Strength Indicator for MT4
User-Friendly Interface: Ideal for both novice and professional traders.
Visual Momentum Detection: Clear histogram color coding for easy interpretation.
Multi-Timeframe Use: Effective for Scalping, day trading, and swing trading.
Free Download: Available for free on IndicatorForest.com.
Practical Tips for Using the Indicator
Always confirm signals with another technical tool.
Avoid trading solely based on color changes in the histogram.
For scalpers, shorter time frames (M15–M30) offer more signals.
For swing traders, higher time frames (H4–D1) provide more reliable results.
Conclusion
The Moving Average Strength Indicator for MT4 is an essential momentum detection tool that helps traders visualize market strength and direction. While not a standalone buy/sell signal generator, it enhances decision-making when combined with price action and trend analysis.
Whether you’re a beginner or an experienced trader, this indicator can become a valuable part of your trading toolkit.
👉 Download it now free from IndicatorForest.com and boost your market analysis accuracy today!
Last Update:
Nov 03, 2025 23:49 PM
Published:
Nov 03, 2025 23:45 PM
Category: