In the fast-moving world of technical analysis, "chart noise" is one of the biggest obstacles to successful trading. Standard candlesticks, while informative, can often appear cluttered with long wicks and erratic gaps, making it difficult to visualize the true direction of a trend. The Linear Price Bar Indicator for MetaTrader 4 (MT4) is a professional-grade visualization tool designed to strip away market secondary noise and present Price Action in its purest, most linear form.
The Power of Linear Visualization
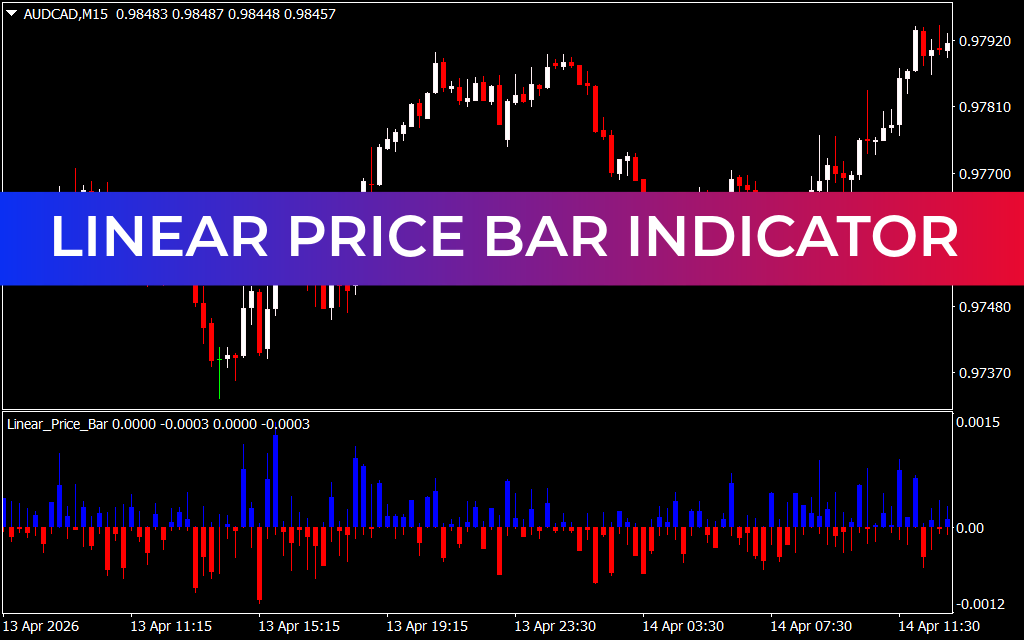
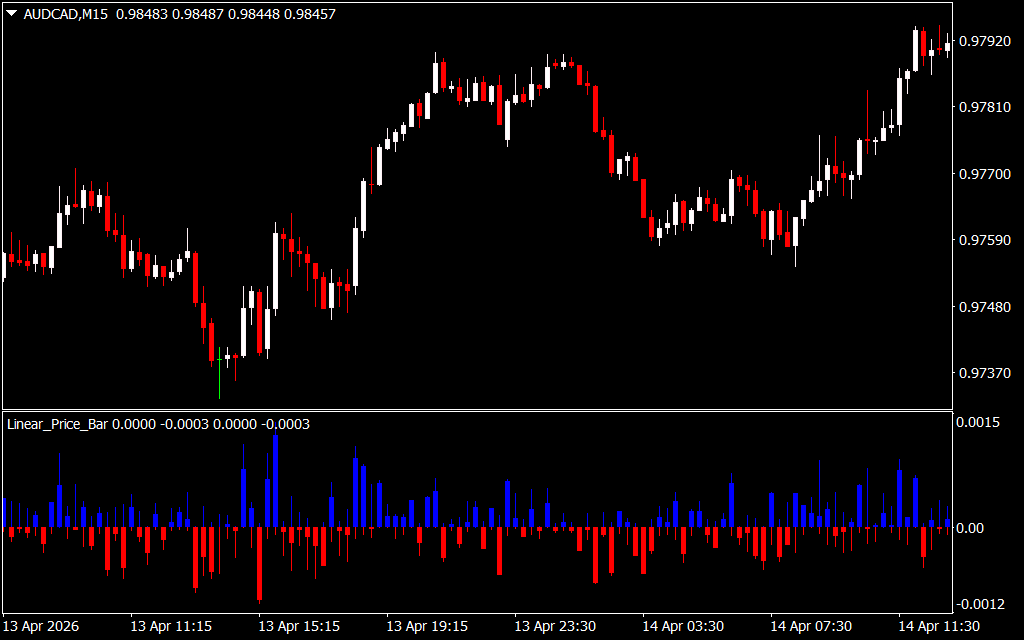
The Linear Price Bar Indicator replaces or overlays traditional candlesticks with a streamlined, dual-colored bar system. By focusing on the relationship between opening and closing values through a linear lens, it provides a much smoother representation of market momentum.
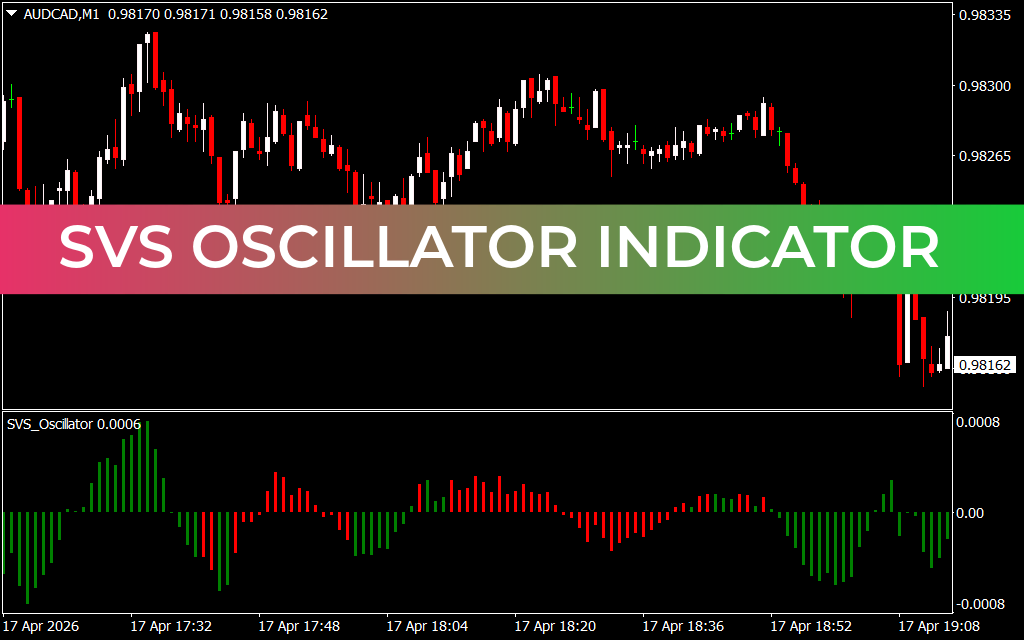
As seen in the recent AUD/CAD M15 chart analysis, the indicator transforms the price pane into a highly readable roadmap:
- The Bullish Phase (Green): When buyers are in control, the indicator plots solid green bars. The lack of distracting wicks allows traders to see the "strength" of the move—the more consistent the green line, the more powerful the uptrend.
- The Bearish Phase (Red): Conversely, when sellers dominate, the indicator switches to solid red. This immediate visual shift prevents traders from hesitating during a market reversal.
- The Trend Ribbon: The indicator often integrates a central trend-line or ribbon that acts as the "spine" of the move. When the price bars remain separated from this ribbon, it indicates high-velocity momentum.
Why Professional Traders Prefer Linear Bars
The primary advantage of the Linear Price Bar Indicator is psychological clarity.
- Eliminating Fakeouts: Many retail traders get stopped out because they react to a long candlestick wick. Linear bars focus on the "meat" of the price move, helping you ignore minor fluctuations and stay in winning trades longer.
- Identifying Market Structure: Because the bars provide a cleaner view, identifying Support And Resistance levels becomes much easier. You can clearly see where the "linear" price has struggled to break higher or lower, creating a more objective trading environment.
- Perfect for Trend Following: If you are a trend follower, this indicator is a game-changer. It allows you to "ride the colors"—as long as the bars remain green, your bullish bias remains intact.
- Optimized for M15 and H1: While it functions perfectly on all timeframes, it is exceptionally powerful on the M15 and H1 charts, where intraday trends develop and exhaust. It provides the stability of a higher-timeframe view with the responsiveness required for day trading.
Seamless Integration and Versatility
The Linear Price Bar Indicator is designed to be the foundation of your trading template. It pairs exceptionally well with momentum oscillators like the RSI or Stochastic. For instance, a "green" linear bar combined with an RSI breakout provides a high-probability "confluence" signal that is much more reliable than using a standard candlestick alone.
Conclusion
The Linear Price Bar Indicator for MT4 is an essential tool for any trader looking to professionalize their chart analysis. By simplifying price action and providing immediate visual confirmation of trend direction, it removes the emotional stress and "analysis paralysis" that plagues many manual traders. Elevate your technical analysis today and start seeing the markets with the clarity of a professional operator.
4 Downloads
Last Update:
Apr 16, 2026 01:08 AM
Published:
Feb 13, 2026 20:50 PM
Category: