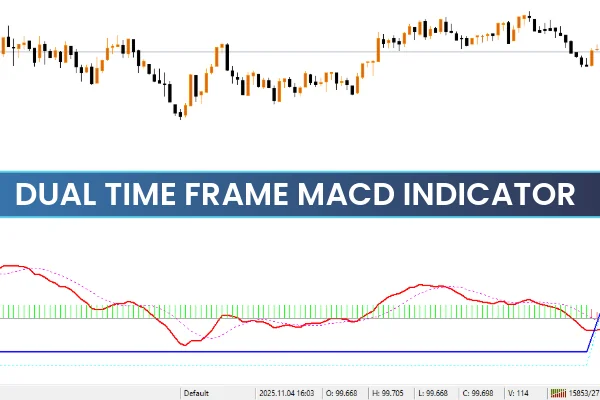
The Dual Time Frame MACD Indicator for MT4 is a powerful trading tool that displays MACD data from two different time frames within a single indicator window. This dual display allows forex traders to instantly compare short-term and higher-timeframe momentum. By seeing both perspectives at once, traders can make more confident and accurate buy or sell decisions.

This indicator is especially useful for trend confirmation, multi-timeframe analysis, and signal synchronization. Whether you’re trading short-term or long-term, using multiple time frames helps reduce false signals and improves consistency in your trading strategy.
How the Dual Time Frame MACD Indicator Works
MACD on Two Levels
The indicator plots two sets of MACD data:
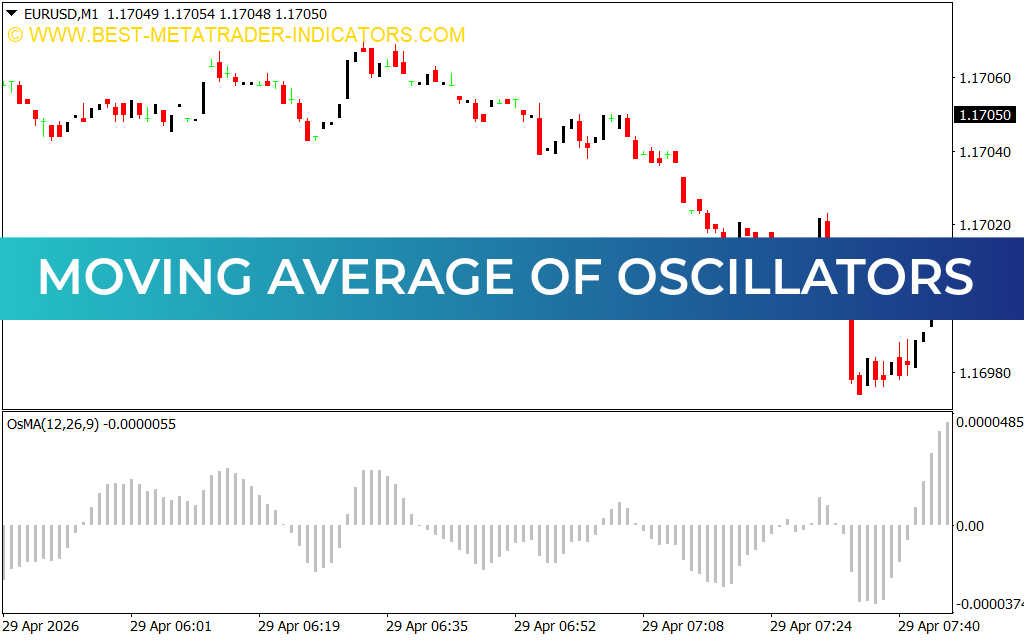
Current Chart Time Frame: Displays the MACD histogram bars showing the immediate momentum.
Next Higher Time Frame: Plots the MACD and signal lines from the next larger time frame, such as H1 on a 30-minute chart or H4 on an hourly chart.
This combination lets you visually align both time frames for better decision-making.
Zero Line Crossover Strategy
A popular trading approach with the Dual Time Frame MACD Indicator involves observing MACD histogram bar crossovers around the zero line:
When histogram bars cross above zero, it signals bullish momentum.
When histogram bars drop below zero, it indicates bearish momentum.
Traders often confirm this signal by checking that the higher time frame MACD trend is aligned with the current one before entering trades.
Dual Time Frame MACD Trade Setup
MACD Line Crossover Strategy
Aggressive traders may rely on the MACD line and signal line crossovers as early entry signals:
A bullish crossover happens when the MACD line moves above the signal line.
A bearish crossover occurs when it moves below.
Confirm these signals with the higher time frame MACD direction to reduce false entries.
Dual Line Crossover Strategy
Another effective strategy uses the crossover between the lower time frame MACD line and the higher time frame MACD line:
When the lower time frame (red) line crosses above the higher time frame (blue) line → it’s a bullish signal.
When it crosses below → it’s a bearish signal.
This method provides an intuitive visual representation of when both time frames are aligned or diverging.
Best Time Frames and Usage Tips
While the Dual Time Frame MACD Indicator for MT4 works across all chart periods, higher time frames such as H1, H4, and D1 tend to yield more reliable trading signals.
Use smaller time frames for quick Scalping setups.
Use higher time frames for swing or position trading.
Always confirm both MACD trends before executing trades.
This indicator also integrates well into automated trading systems (EAs), allowing traders to code strategies that depend on dual timeframe confirmation.
Conclusion
In summary, the Dual Time Frame MACD Indicator for MT4 is a must-have for traders who use the MACD (Moving Average Convergence Divergence) strategy and want to combine multiple time frames for more accurate entries and exits. It simplifies your analysis by showing short-term and long-term momentum in one place, making it easier to spot true market trends.
Enhance your MT4 strategy today—download the Dual Time Frame MACD Indicator at IndicatorForest.com and take your multi-timeframe trading to the next level.
Published:
Nov 04, 2025 12:25 PM
Category: