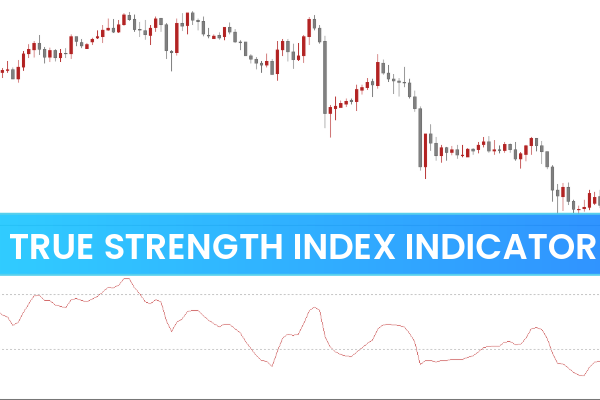
The True Strength Index (TSI) Indicator for MT5 is a momentum-based oscillator that helps traders identify the strength and direction of a market trend. Available on IndicatorForest.com, this indicator measures price momentum by comparing price changes over time, offering valuable insight into whether bulls or bears are in control.
Unlike simple moving averages or stochastic oscillators, the True Strength Index focuses on true market momentum, filtering out noise to give traders a clearer view of the underlying trend. It is suitable for all trading styles — including Scalping, intraday, and swing trading.
How to Understand the True Strength Index
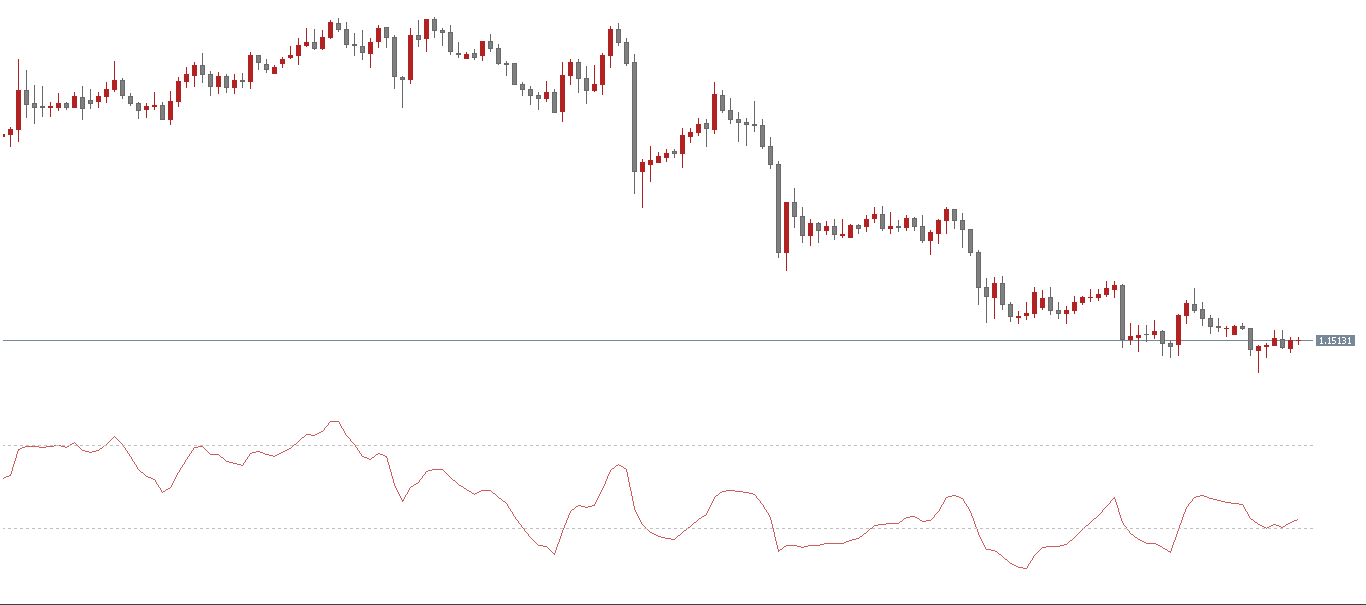
The TSI indicator is very easy to interpret. It is plotted around a centerline (0.00 level):
When the TSI line is above zero, the trend momentum is considered bullish, suggesting that prices are likely to continue rising.
When the line is below zero, the trend momentum is bearish, implying that sellers dominate the market.
This straightforward interpretation makes the True Strength Index an ideal tool for both beginner and experienced traders. It visually represents whether the market has the energy to continue in its current direction or if a reversal may be forming.
How to Trade Using the True Strength Index Indicator
The True Strength Index Indicator for MetaTrader 5 (MT5) doesn’t directly generate buy or sell signals. Instead, it helps traders evaluate when to trade by revealing the current momentum strength of an asset.
Here are a few ways to trade using this indicator:
Combine with Price Action
Pair the TSI indicator with Price Action analysis to confirm potential entries. For instance, if the price forms a bullish pattern while the TSI crosses above zero, this can confirm a potential buy setup.
Use with Other Indicators
Combine it with trend-following indicators such as Moving Averages, MACD, or Parabolic SAR to enhance trade confirmation and reduce false signals.
Check out the Parabolic SAR Mtf Indicator on IndicatorForest.com
Identify Overbought/Oversold Areas
Although the True Strength Index doesn’t have fixed overbought or oversold zones like RSI or Stochastic, you can still detect these conditions by observing extreme peaks and troughs in the indicator line. This technique helps anticipate potential reversals.
Benefits of Using the True Strength Index Indicator for MT5
High Sensitivity
The indicator reacts quickly to price changes, providing near real-time insights into momentum shifts.
Lag-Free Analysis
The True Strength Index minimizes lag, helping traders spot early trend reversals before major moves occur.
Versatility
Whether you’re trading Forex, stocks, or commodities, the TSI indicator can adapt to any market or time frame.
User-Friendly Design
It’s perfect for traders of all levels. Even beginners can interpret momentum shifts with ease using the zero-line reference.
Why Download from IndicatorForest.com?
At IndicatorForest.com, you can download the True Strength Index Indicator for MT5 absolutely free. Our indicators are optimized for accuracy, simplicity, and performance. We also offer a wide library of trading tools, strategies, and tutorials to help traders succeed.
Visit IndicatorForest.com today and enhance your trading with the best custom indicators for MetaTrader.
Conclusion
The True Strength Index Indicator for MT5 is an essential tool for traders seeking to measure market momentum and identify trend direction. It’s fast, precise, and easy to read, making it an ideal companion for both novice and professional traders. Use it alongside price action or other technical tools to confirm your trades and improve your results.
👉 Download the True Strength Index Indicator for MT5 free at IndicatorForest.com and start trading with confidence today!
2 Downloads
Published:
Nov 04, 2025 01:22 AM
Category: