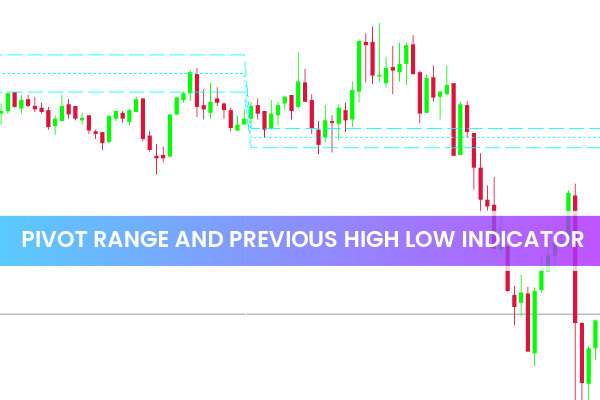
The Pivot Range and Previous High-Low Indicator is a technical analysis tool designed to help traders identify dynamic Support And Resistance zones across all trading sessions. By plotting the pivot range and high-low levels directly on your MetaTrader 4 (MT4) charts, this indicator provides an instant visual guide to critical price levels that can define market direction.
This indicator is particularly useful for day traders and swing traders who want to align their trades with major price turning points. It combines traditional pivot levels with the high-low range to highlight potential breakout zones, trend continuations, or reversals.
How the Indicator Works on MT4
When you apply the Pivot Range and Previous High-Low Indicator for MT4, it automatically calculates and displays:
Pivot Range: The central area where market momentum tends to shift.
Previous High and Low: Levels that represent the highest and lowest prices from the last trading session.
Dynamic Price Channel: A visual range indicating potential support and resistance zones for upcoming sessions.
By observing how the price reacts around these levels, traders can determine whether the market is trending, consolidating, or preparing for a reversal.
How to Identify Buy and Sell Signals
The Pivot Range and Previous High-Low MT4 Indicator serves as a dynamic breakout tool. Here’s how to interpret its signals:
Bullish Signals
When the price breaks above the pivot range, it indicates a bullish market sentiment.
Traders can look for buy opportunities as the price moves upward toward the high of the channel.
A pullback near the pivot line offers a good entry point, with a stop-loss (SL) below the lower band.
Bearish Signals
If the price drops below the pivot range, it signals a potential bearish trend.
Look for sell entries near the upper resistance of the channel, placing your SL above the high band.
This approach minimizes false signals while ensuring trades align with the dominant market momentum.
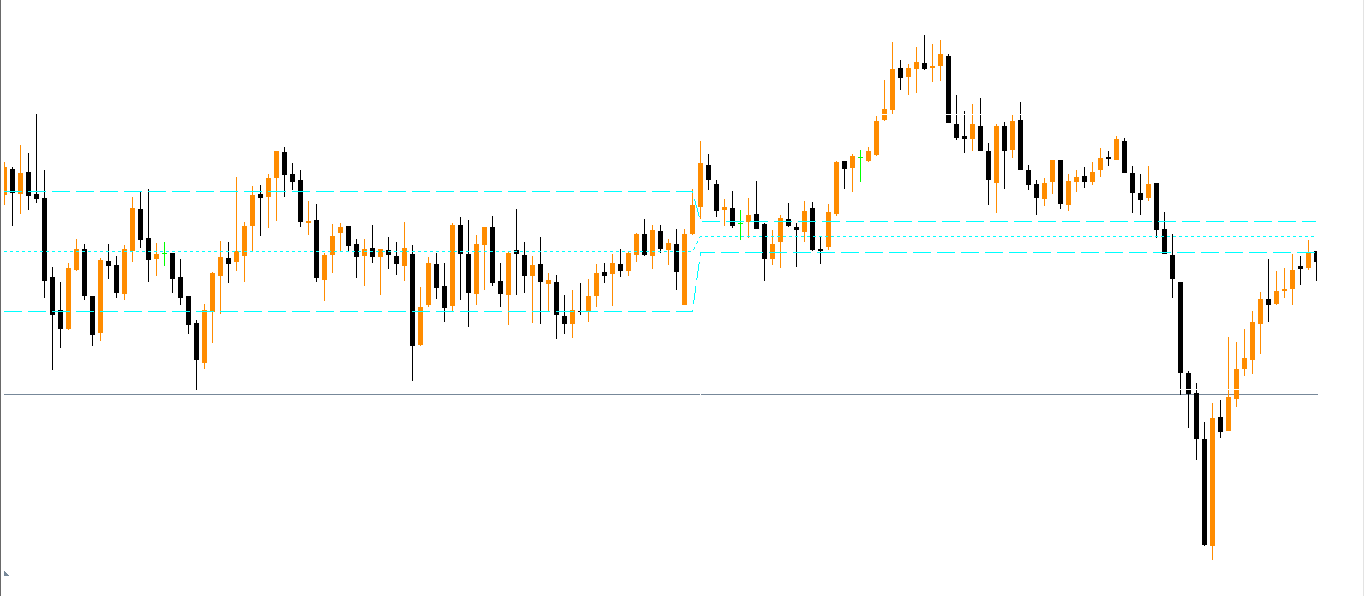
Example: EUR/USD 4-Hour Chart
In a recent EUR/USD example, the price initially traded in an uptrend but reversed when it fell below the pivot range. Shortly after, a breakout below the channel’s low confirmed a strong bearish trend. Traders who entered short positions at that moment gained from the downward momentum, proving how effectively the indicator captures real-time sentiment shifts.
Benefits of Using the Pivot Range and Previous High-Low Indicator
Multi-timeframe compatibility: Works across different chart periods.
Improved accuracy: Confirms entries using both pivot levels and dynamic channels.
Versatility: Can be combined with existing strategies like moving averages or RSI.
Simplicity: Easy to install and interpret for both beginners and professionals.
This indicator helps traders make data-driven decisions rather than relying on pure intuition, which enhances consistency in trading performance.
Pro Tips for Better Results
Combine the indicator with a trend confirmation tool such as the Advanced MTF RSI Indicator available on IndicatorForest.com.
Always consider higher timeframes (H4, Daily) for stronger confirmation.
Avoid entering trades solely on breakouts—wait for candle closure beyond the pivot zone.
Conclusion
The Pivot Range and Previous High-Low Indicator for MT4 is a powerful yet simple tool that enables traders to make confident trading decisions based on real Market Structure. It provides a blend of pivot levels and high-low data to visualize key market zones—perfect for identifying buy and sell opportunities in any trading session.
Enhance your strategy today by downloading this indicator from IndicatorForest.com and start trading with greater precision and clarity.
1 Download
Published:
Nov 04, 2025 00:02 AM
Category: