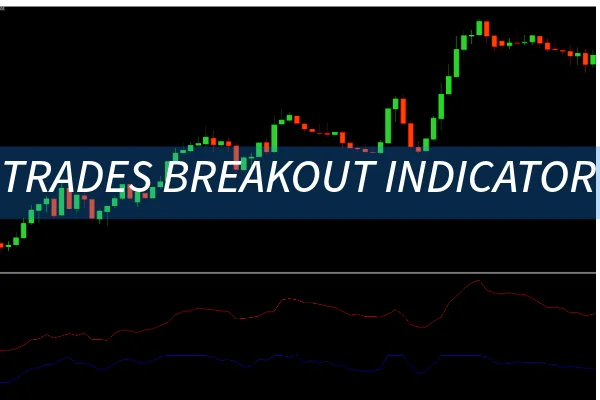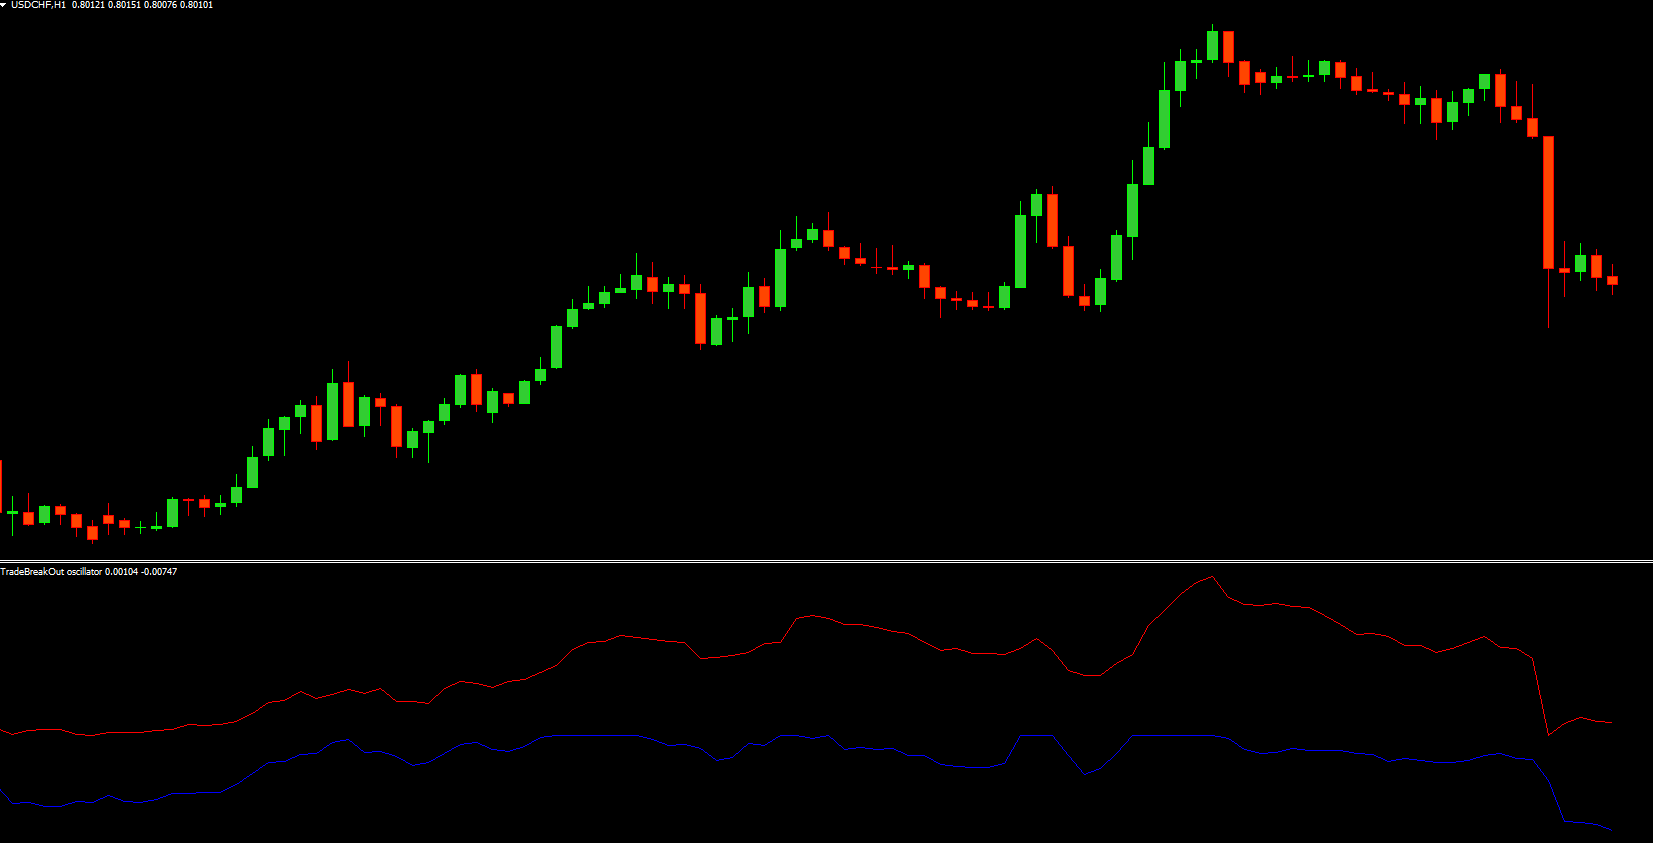
The Trade Breakout Indicator for MT4 helps traders identify market divergences by plotting red and blue lines on the chart. Divergence is a key concept in technical analysis, focusing on the relationship between price action and oscillator movement.

When the price moves in the opposite direction of the indicator, it often signals a potential reversal. This makes the Trade Breakout Indicator a powerful tool for spotting bullish or bearish divergence before major market moves occur.
At IndicatorForest.com, traders can access this and other professional-grade Forex indicators designed for precise and easy market analysis.
Divergence is generally categorized into two types: bullish and bearish.
Bullish Divergence
A bullish divergence happens when the price forms a lower low, but the oscillator (blue line) forms a higher low. This suggests weakening selling pressure, often followed by a bullish reversal.
Bearish Divergence
A bearish divergence occurs when the price forms a higher high, but the oscillator (red line) forms a lower high. This indicates that buying pressure is diminishing and may lead to a bearish reversal.
The Trade Breakout Indicator MT4 visually represents these divergences using its blue (bullish) and red (bearish) lines, making it simple for traders to interpret.
Using the Trade Breakout Indicator for MetaTrader 4 (MT4) is straightforward. Let’s look at how it works with an example, such as the GBP/CAD H4 chart.
Install and Apply the Indicator:
Load the Trade Breakout Indicator onto your MT4 chart.
Observe the Divergence Lines:
The red and blue lines appear on the chart, representing bearish and bullish divergences respectively.
Analyze the Divergence Patterns:
When the blue line forms higher lows while the price forms lower lows, this is a bullish signal.
When the red line forms lower highs while the price forms higher highs, this is a bearish signal.
Confirm with Support and Resistance:
Combine the indicator with support and resistance levels for greater accuracy.
A buy signal occurs when price breaks above resistance while showing bullish divergence.
A sell signal appears when price breaks below support while showing bearish divergence.
This combination increases confidence in trend reversal confirmation and helps filter out false signals.
Use multiple timeframes: Check divergences on both H4 and Daily charts for stronger setups.
Add trend filters: Combine with a moving average or RSI indicator to confirm momentum.
Risk management: Always apply stop-loss levels below recent swing lows or above swing highs to protect capital.
By monitoring the divergences between price and the Trade Breakout Indicator’s lines, traders can spot turning points earlier and make better entry or exit decisions.
Clear visual cues with red and blue divergence lines.
Compatible with MT4 and easy to install.
Improves timing for market entries and exits.
Supports multiple asset classes including Forex, commodities, and indices.
Whether you’re a beginner or a professional trader, this indicator offers a reliable method to understand market sentiment and price exhaustion before trends shift.
The Trade Breakout Indicator for MT4 is an essential tool for detecting market divergences and predicting potential reversals. By using its red and blue divergence lines, traders can identify early buy or sell opportunities with greater confidence.
Visit IndicatorForest.com today to download the Trade Breakout Indicator and explore our full range of premium Forex indicators designed to enhance your trading strategy.
Published:
Oct 11, 2025 11:00 AM
Category: