Master High-Conviction Entries with the XTC Trend Indicator for MT4
In the relentless environment of the foreign exchange market, the ability to separate genuine trend reversals from minor corrective pullbacks is the hallmark of a professional trader. Many retail participants fail because they lack a mechanical way to quantify momentum shifts, leading to premature entries or holding losing positions for too long. The XTC Trend Indicator for MetaTrader 4 (MT4) is a professional-grade technical solution designed to bridge this gap. By utilizing a sophisticated dual-phase histogram, it provides a definitive, real-time visualization of market energy and directional bias.
The Science of Trend Polarization
The XTC Trend Indicator is built on the principle of momentum polarization. Rather than relying on a single lagging average, the XTC algorithm analyzes the velocity of Price Action relative to structural volatility. It then transforms this complex data into a clean, actionable histogram in a dedicated sub-window. This visual clarity allows traders to immediately identify the "market regime"—whether the bulls or the bears are in operational control.
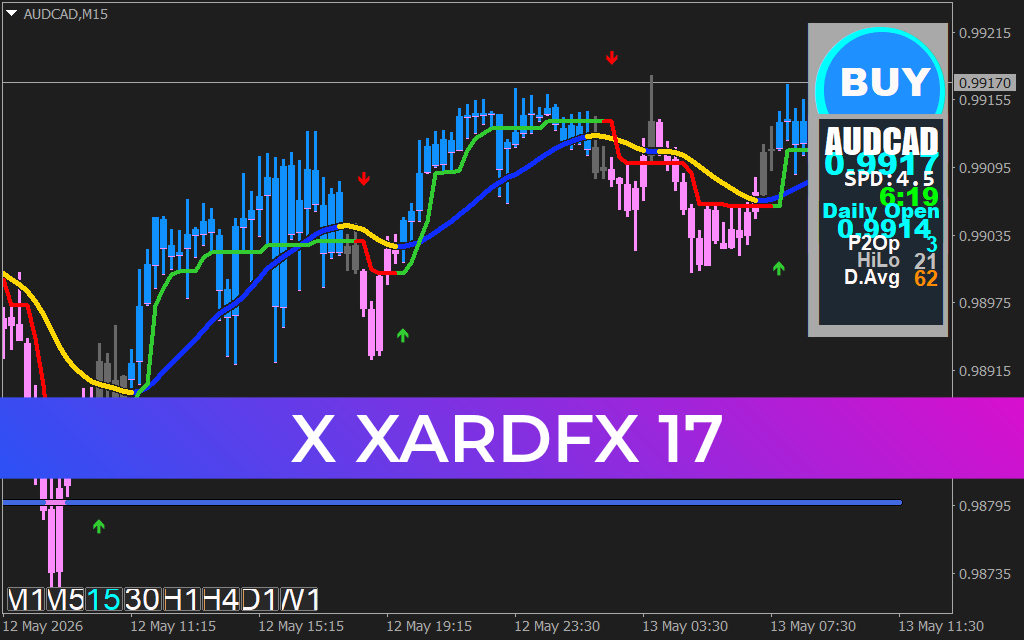
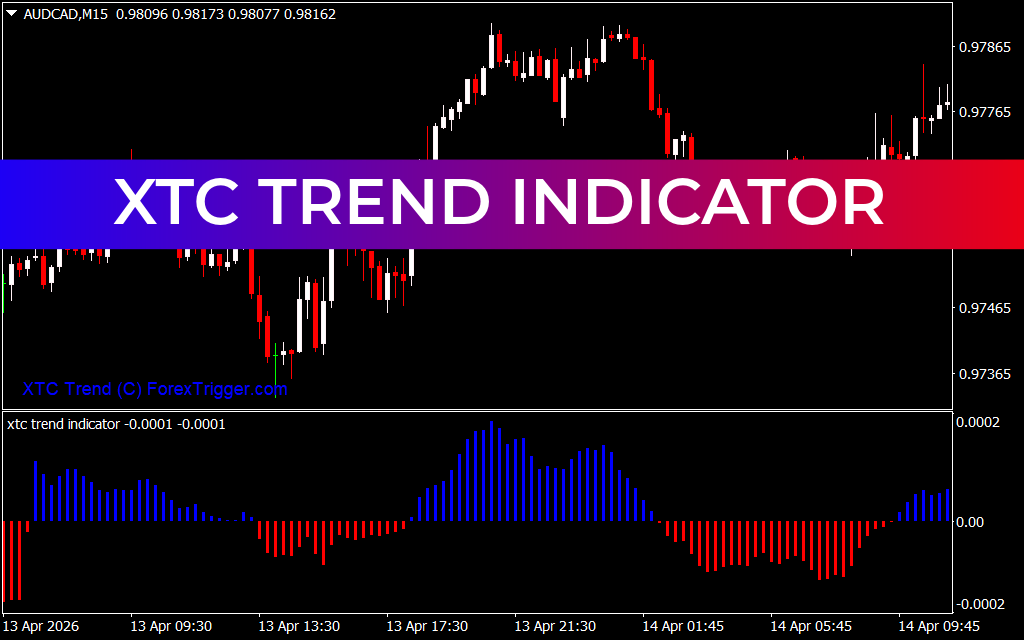
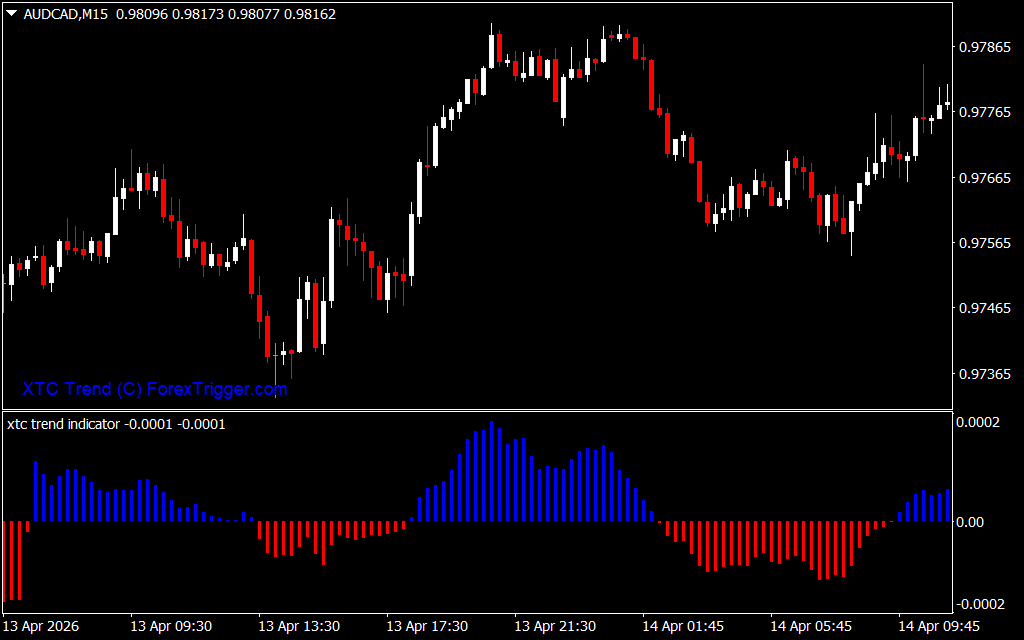
As demonstrated in technical analysis on diverse pair structures like AUD/CAD on the M15 timeframe, the XTC Trend system provides several definitive operational advantages:
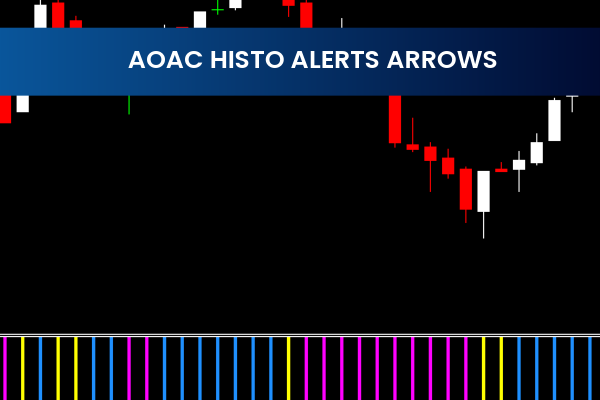
- Zero-Lag Momentum Visualization: The indicator uses a color-coded histogram—typically blue for bullish momentum and red for bearish pressure. As seen on recent M15 charts, the transition from red to blue often marks the precise moment of a trend rotation, allowing for early but confirmed entry points.
- Volumetric Trend Strength: The height of the bars in the XTC histogram quantifies the strength of the move. Rising blue bars indicate an accelerating uptrend with institutional backing, while shrinking bars suggest a trend is losing steam, providing a mechanical warning to tighten stop-losses.
- Noise Filtration in Consolidations: During "choppy" market phases where standard indicators produce multiple false signals, the XTC Trend remains grounded. Its smoothing algorithm requires a definitive momentum threshold to be met before flipping bias, keeping traders on the sidelines during low-probability ranging periods.
- Precise Divergence Identification: By comparing the peaks of the XTC histogram with price action, traders can spot momentum divergences. If price makes a higher high but the XTC Trend shows a lower blue peak, it serves as a professional-grade signal of an impending trend exhaustion.
Strategic Implementation for Systematic Success
The XTC Trend Indicator is an essential asset for any trader who values a disciplined, momentum-driven approach to the markets.
- The Trend-Following Core: For high-conviction setups, align the XTC Trend with a higher timeframe bias. Only look for "Buy" setups on the M15 when the H1 histogram is also blue. This ensures you are trading with the path of least resistance.
- Scalping During Momentum Bursts: On lower timeframes like the M1, the XTC Trend is world-class at identifying rapid momentum bursts. Scalpers can use the first two bars of a color flip to enter high-velocity trades with tight stops.
- Mechanical Exit Strategy: The return of the histogram bars toward the zero line provides a definitive, non-emotional reason to exit a trade or scale out of a position, protecting your realized profits from sudden reversals.
Conclusion
The XTC Trend Indicator for MT4 is a definitive solution for traders who demand institutional-grade clarity. By transforming abstract price movements into a simple, visual momentum map, it empowers you to navigate the financial markets with grounded, professional confidence. Elevate your technical analysis today and master the trend with the XTC system.
SEO Meta Description
2 Downloads
Last Update:
Apr 18, 2026 19:47 PM
Published:
Feb 04, 2026 18:42 PM
Category: