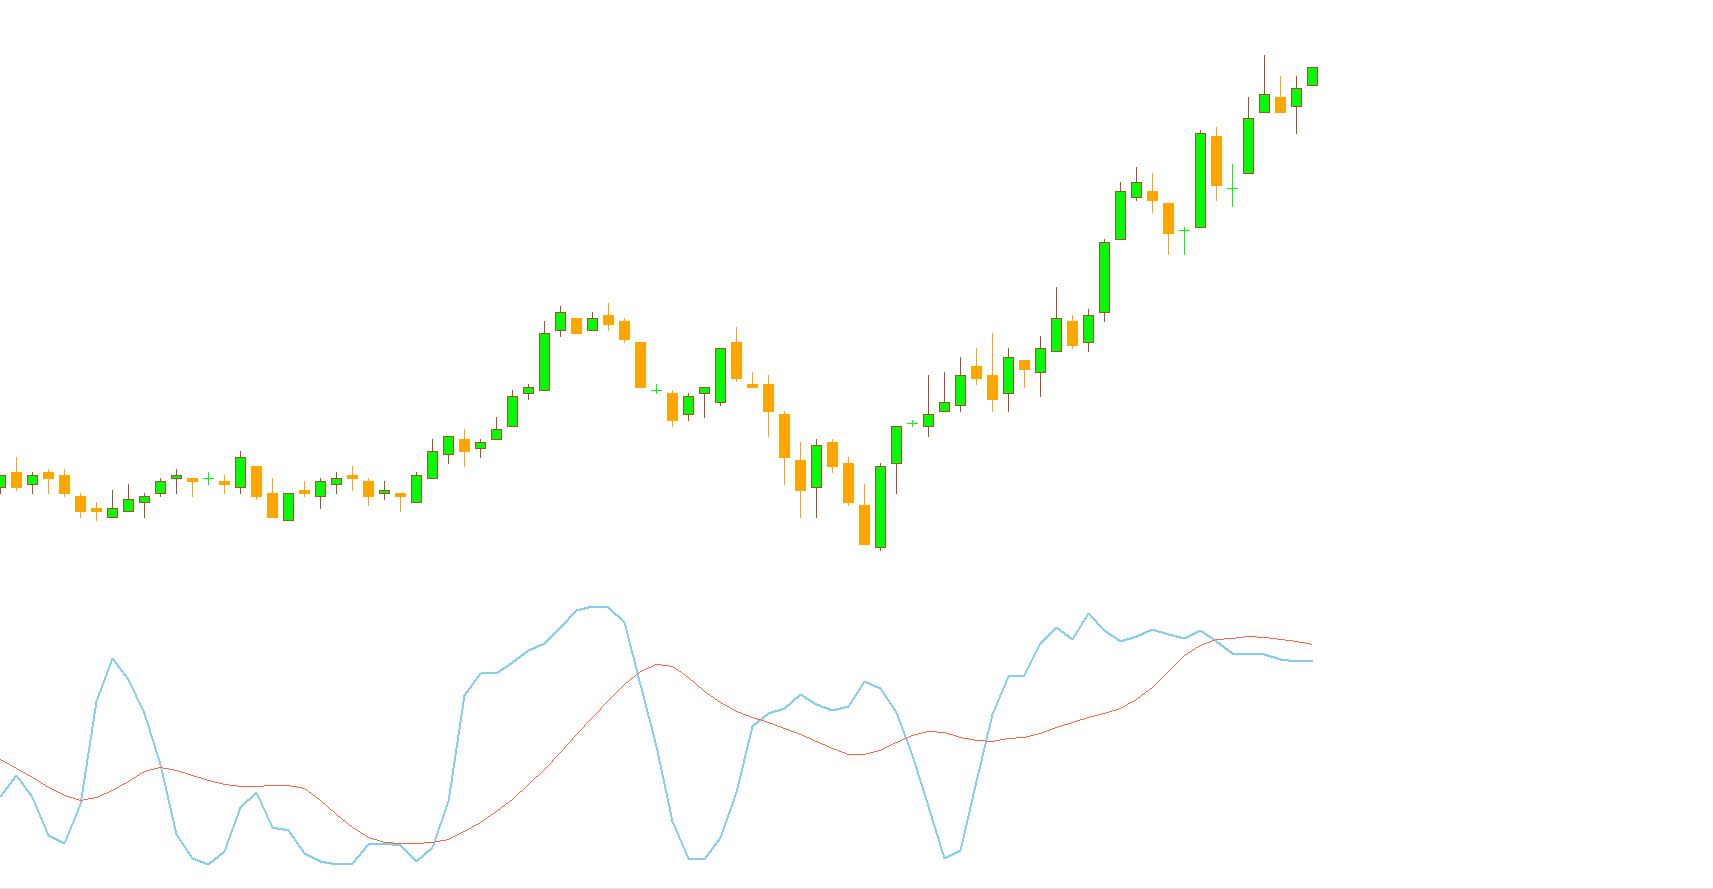
The R Squared Indicator is a powerful tool that traders use to identify overbought and oversold market conditions. Part of the oscillator family, it works similarly to the RSI (Relative Strength Index) and Stochastic indicators. Oscillating between 0 and 101, the R Squared Indicator provides clear trend direction signals through its two main lines: Length and Smooth.
Understanding the R Squared Indicator
The R Squared Indicator is designed for traders looking to assess momentum and market trends. Its simplicity makes it effective across multiple timeframes, though it performs best on longer-term charts. By tracking oscillations between 0 and 101, traders can quickly spot when an asset is likely to reverse or continue its trend.
How the Oscillator Works
The indicator includes two signal lines: Length and Smooth, both with similar periods. These lines help highlight overbought and oversold levels:
Overbought Level: When the signal line approaches 101, it suggests the market may be overbought. Traders can consider shorting the asset or exiting long positions.
Oversold Level: When the signal line nears 0, it indicates an oversold market. Traders might enter long positions or close short positions.
Even though the R Squared Indicator provides clear signals, it is recommended to combine it with other tools like Moving Averages (MA) or RSI to reduce the risk of false signals.
R Squared Indicator BUY/SELL Signals
For practical trading, using the R Squared Indicator to generate BUY and SELL signals involves:
Identifying oversold regions (signal line near 0) to consider buying.
Recognizing overbought zones (signal line near 101) to consider selling.
Cross-checking signals with other indicators to confirm trends.
For example, in the EUR/USD H4 chart, traders can spot BUY signals when the market is oversold and SELL signals when it is overbought. Combining these signals with trend analysis and volume indicators enhances accuracy.
Best Practices for Using the R Squared Indicator
Apply it primarily on higher timeframes to reduce noise.
Use alongside MA, RSI, or other oscillators to confirm market trends.
Avoid relying solely on the R Squared Indicator for trading decisions due to potential false signals.
Conclusion
The R Squared Indicator is a reliable momentum oscillator that identifies overbought and oversold levels. By following its signals, traders can make informed decisions and improve their trading strategies. Download the R Squared Indicator for free at IndicatorForest.com and enhance your trading toolkit today.
2 Downloads
Published:
Nov 04, 2025 10:14 AM
Category: