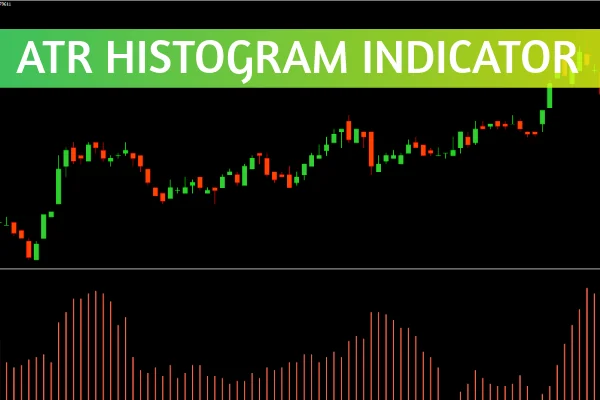
The ATR Histogram Indicator is a powerful trading tool that gives traders a clear visualization of market volatility on the MetaTrader 4 (MT4) platform. Built on the Average True Range (ATR) concept, this indicator plots volatility values as histogram bars, making it easier to track how market conditions change over time.

Using the ATR Histogram Indicator for MT4, traders can better determine when volatility is expanding or contracting—key insights that help identify optimal trade entry and exit points, adjust stop-loss settings, and manage risk exposure efficiently.
Whether you are a day trader, swing trader, or position trader, this indicator simplifies complex volatility analysis, making it a versatile addition to any trading strategy.
The ATR Histogram Indicator calculates the Average True Range of price movements over a chosen period and represents these values as bars (the histogram). The height of each bar reflects the level of volatility during that time frame:
Higher bars indicate rising volatility, signaling potential breakout conditions.
Lower bars suggest calmer markets, suitable for range-bound trading.
This visual representation allows traders to instantly assess market dynamics without relying solely on numerical ATR readings. The result is faster, more intuitive decision-making in live market conditions.
When the ATR histogram bars expand, volatility is increasing. Traders can look for breakout opportunities, especially near key support and resistance levels. This helps anticipate large price movements that may follow a volatility surge.
Conversely, when histogram bars contract, the market is likely consolidating. This can be a sign to prepare for upcoming breakouts or employ range-trading strategies, targeting smaller, consistent profits between established price boundaries.
One of the most practical uses of the ATR Histogram Indicator for MT4 is risk management. By observing volatility changes, traders can dynamically adjust their stop-loss distances. For example, during high volatility, wider stop losses can prevent premature exits, while during low volatility, tighter stops can protect profits.
Clarity: Visual representation simplifies volatility tracking.
Flexibility: Works across all timeframes and currency pairs.
Risk Control: Helps set more effective stop-loss levels.
Compatibility: Easy to install and use on the MT4 trading platform.
These advantages make it ideal for both beginners and professional traders aiming to improve decision-making and refine their technical analysis approach.
Combine it with trend indicators such as Moving Averages or MACD to confirm trade direction.
Avoid using it as a standalone signal; instead, use it as part of a confluence trading strategy.
Monitor multiple timeframes for a broader perspective on volatility trends.
In summary, the ATR Histogram Indicator for MT4 is an essential volatility-based trading tool that enhances your understanding of market dynamics. By converting raw ATR data into a simple visual format, it empowers traders to make better, data-driven decisions, manage risk effectively, and improve trading performance.
Ready to elevate your trading strategy? Download the ATR Histogram Indicator now at IndicatorForest.com and experience the difference in how you read market volatility.
Published:
Oct 21, 2025 15:47 PM
Category: