The Tick Chart Weighted Indicator is one of the most powerful tools for short-term and intraday traders. Unlike traditional time-based charts, it builds bars based on the number of transactions instead of time intervals. This allows traders to view market activity more dynamically. During periods of high trading volume, such as after a market opens, the Tick Chart Weighted provides more information than a standard one-minute chart.
This approach helps you detect price movements, spot reversal signals, and find more trading opportunities — all in real time.
Each bar on the tick chart is formed after a set number of transactions, which traders can customize. For example, you may choose 100 ticks, meaning each bar represents 100 completed trades. Because transaction activity varies throughout the day, the X-axis of the chart is not uniform, unlike time-based charts.
This non-uniform structure gives you an accurate reflection of market volatility, making it a great tool for scalpers and day traders.
The weighted tick price line is calculated using this formula:
(High + Low + Close + Close) ÷ 4
This formula creates a value that differs from both median and typical candle prices. The inclusion of an extra closing price emphasizes recent market sentiment, making the indicator more responsive to sudden shifts.
Because of this weighting, the Tick Chart Weighted Indicator works best with intraday trading strategies and helps in identifying both support and resistance zones.
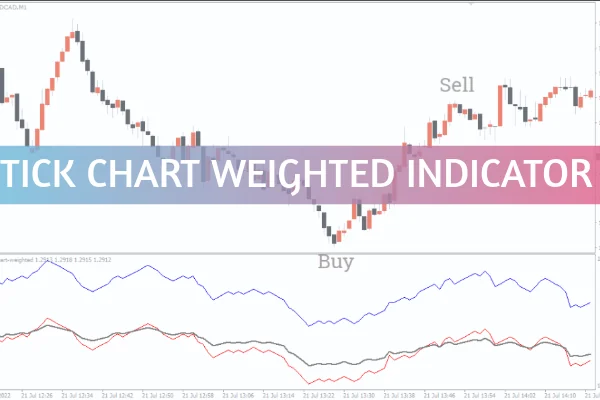
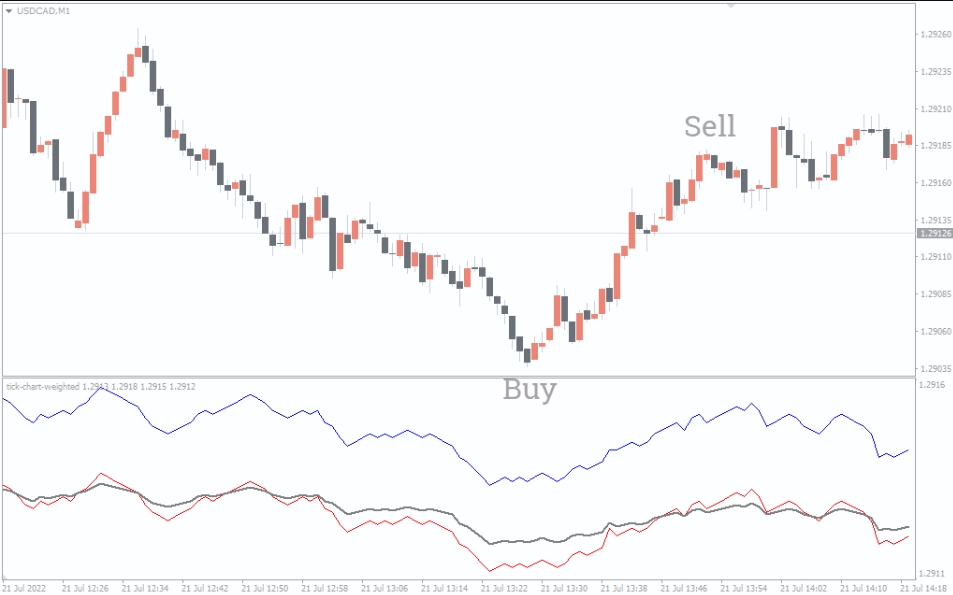
Using the indicator effectively requires understanding how the price line, bid line (red), and ask line (blue) interact.
When the red bid line bounces off the weighted price line, it often signals a bearish reversal.
When the blue ask line bounces off, it indicates a bullish signal in the market.
These real-time trading signals help traders enter or exit positions with precision. For instance, when the red line rebounds downward from the price line, a short-selling opportunity may arise. Similarly, when the blue line bounces upward, traders can consider going long.
Imagine a high-volatility period after the market opens. The Tick Chart Weighted Indicator displays the red bid line bouncing off the price line, suggesting selling pressure. Shortly after, the price drops by several pips — validating the bearish signal.
Conversely, during an uptrend, the blue ask line bounces off the price line, confirming a bullish momentum. These signals appear ahead of traditional time-based indicators, giving traders a competitive edge.
Provides more trading opportunities during volatile sessions.
Offers real-time signals for faster decision-making.
Helps identify market reversals before they are visible on time charts.
Can be customized based on transaction volume.
Ideal for scalping and short-term strategies.
The combination of responsiveness and flexibility makes the Tick Chart Weighted one of the best intraday trading indicators available.
The Tick Chart Weighted Indicator is a must-have tool for traders looking to capitalize on short-term price movements. Its weighted formula, real-time responsiveness, and customizable settings provide superior insight into market behavior during high activity.
By mastering its use, you can enhance your entry and exit timing, reduce risk, and boost your trading performance.
👉 Start using the Tick Chart Weighted Indicator today at IndicatorForest.com and take your intraday trading to the next level.
Published:
Oct 20, 2025 06:38 AM
Category: