Master Dynamic Trend Following with the F Channel Indicator for MT4
In the fast-paced world of technical analysis, traders are constantly searching for tools that can accurately define market boundaries while adapting to ever-changing volatility. The F Channel Indicator for MetaTrader 4 (MT4) is a premier structural tool designed to provide a clear visual framework for Price Action. By plotting dynamic upper and lower boundaries based on recent price extremes, this indicator helps traders identify breakout opportunities, reversal zones, and the overall strength of a market trend with professional-grade precision.
The Anatomy of the F Channel
The F Channel operates on the principle of price elasticity. It acknowledges that while price moves in trends, it rarely moves in a straight line. Instead, it oscillates between two main structural poles. The F Channel captures these poles by creating a jagged, adaptive envelope around the price action.
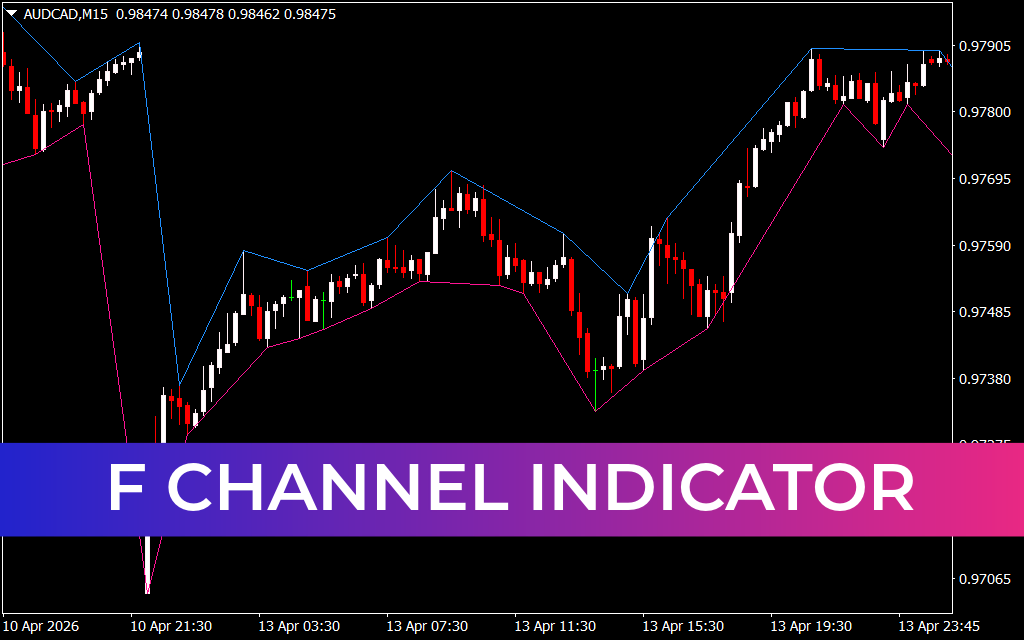
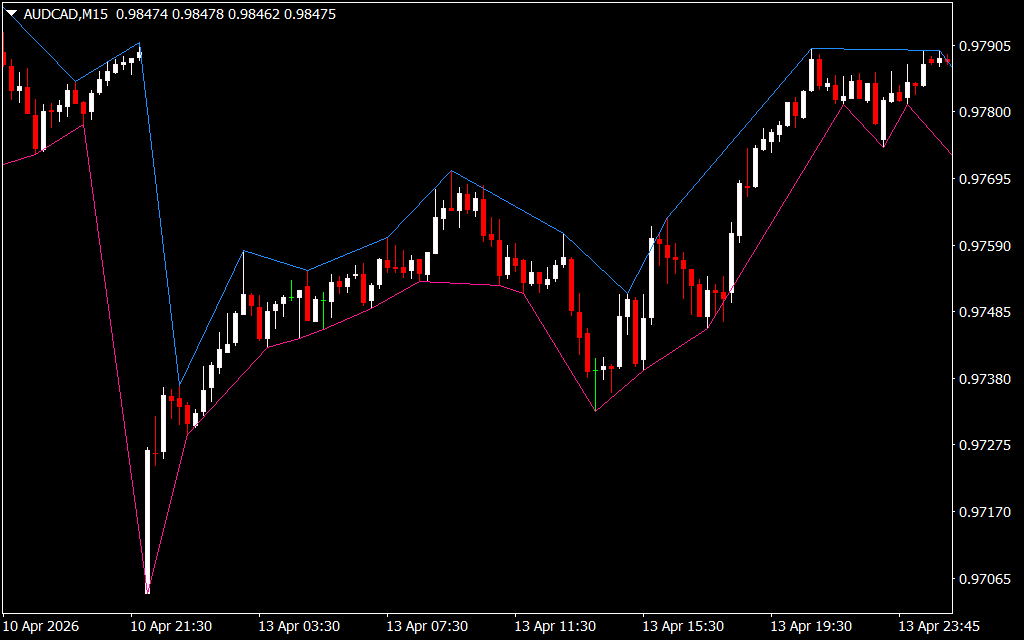
As demonstrated in the recent AUD/CAD M15 chart analysis, the indicator features a distinct two-color system:
- The Upper Boundary (Cyan): This line tracks the "ceiling" of the current Market Structure. In a bullish environment, price will often ride along this cyan line. When price pulls away from it, it may signal a temporary exhaustion.
- The Lower Boundary (Magenta): This line represents the "floor" of the trend. During a bearish move, the magenta line acts as a dynamic support level. A decisive break below this floor often confirms a trend acceleration or a major structural shift.
- The Structural Voids: Unlike smooth Bollinger Bands, the F Channel uses a "stepped" or jagged approach. This is crucial because it highlights the exact price levels where the market has previously established local highs and lows, providing a more "honest" view of market structure.
Strategic Advantages for Day Traders
The F Channel is a versatile tool that can be integrated into a wide variety of trading systems.
- High-Probability Reversals: When price action touches the magenta boundary during an oversold condition, or the cyan boundary during an overbought peak, it provides a clear "zone of interest" for potential counter-trend trades.
- Breakout Confirmation: One of the most effective ways to use the F Channel is to trade the "break and retest." If price breaks out of the cyan upper boundary and then holds above it, it confirms that a new, more aggressive bullish phase has begun.
- Objective Stop-Loss Placement: The F Channel provides data-driven levels for risk management. For a long position, placing a stop-loss just below the current magenta boundary ensures your trade is protected by the market's own structural floor.
- Trend Strength Visualization: The slope of the channel lines provides an immediate read on trend velocity. Steeply angled boundaries indicate a high-momentum environment, while flat boundaries warn of a range-bound market where patience is required.
Conclusion
The F Channel Indicator for MT4 is an essential upgrade for any trader who relies on visual market structure. By providing clear, adaptive boundaries, it removes the subjectivity of manual trendline drawing and allows you to focus on high-probability execution. Whether you are a scalper seeking quick bounces or a swing trader riding long-term moves, the F Channel offers the structural clarity needed to stay ahead of the curve.
5 Downloads
Last Update:
Apr 16, 2026 01:25 AM
Published:
Feb 13, 2026 20:36 PM
Category: