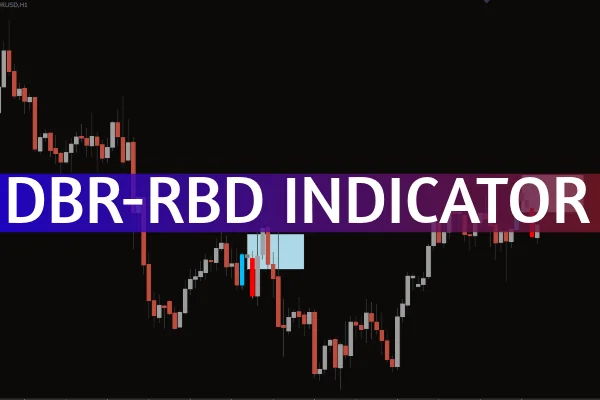
The DBR-RBD Indicator for MT4 is an advanced trading tool designed to automatically detect two essential Smart Money price action patterns — Drop-Base-Rally (DBR) and Rally-Base-Drop (RBD). These formations often indicate institutional order blocks, highlighting high-probability supply and demand zones where major market participants are likely to act.
By plotting these zones directly on your chart with customizable rectangles, the DBR-RBD tool removes the guesswork from manual analysis. Whether you’re an intraday trader or a swing trader, this indicator helps you trade with the precision and confidence that professional institutions use.
In Smart Money Concepts (SMC) and supply-demand trading, understanding DBR and RBD formations is key to anticipating future price movements.
Drop-Base-Rally (DBR): A bearish move (Drop) followed by consolidation (Base), then a bullish impulse (Rally). This pattern forms a demand zone, where buyers are expected to re-enter the market.
Rally-Base-Drop (RBD): A bullish move (Rally) followed by a pause (Base), then a bearish move (Drop). This marks a supply zone, where sellers are likely to step in again.
These zones reflect where institutional orders have been placed. When price returns to these levels, traders often anticipate strong reactions.
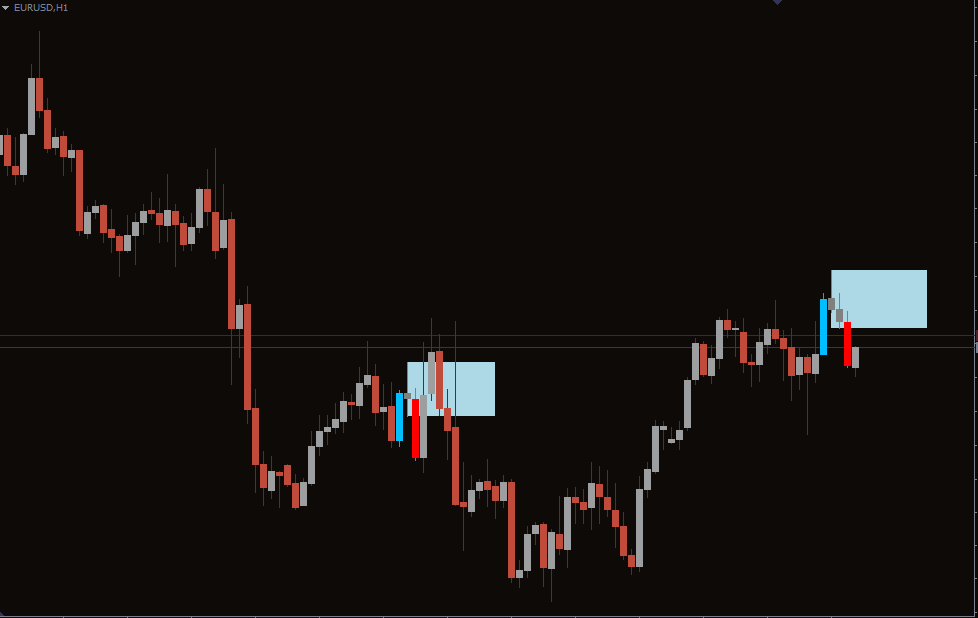
The DBR-RBD Indicator automatically scans the chart for DBR and RBD formations, plotting color-coded rectangles over the relevant zones.
Automatic Zone Detection: Instantly marks valid supply (RBD) and demand (DBR) areas without manual drawing.
Customizable Visuals: Adjust colors, transparency, and zone depth for a clean and professional chart appearance.
Multi-Timeframe Compatibility: Works seamlessly across different timeframes, from M1 scalping charts to D1 swing setups.
Smart Refresh Logic: Updates dynamically as new structures form, ensuring zones remain relevant and accurate.
The indicator doesn’t provide buy or sell arrows — instead, it highlights the high-probability reaction zones where traders can apply confirmation tools like candlestick patterns, divergence, or volume analysis.
An RBD zone signals an area of supply where price may reverse downward. When the market rallies into a previously established RBD zone, look for:
Rejection wicks or bearish engulfing candles
RSI or MACD divergence
Lower-timeframe breakdowns confirming supply
These confluences can strengthen your short setups.
A DBR zone marks a demand area where buying pressure often resumes. When price pulls back into this zone, confirmation may appear as:
Bullish engulfing or pin bars
Increased volume or momentum divergence
Structure shifts signaling demand re-entry
These signs indicate a high-probability area to consider long entries.
The DBR-RBD Indicator for MT4 offers multiple advantages:
Eliminates subjectivity: No more manual guessing of supply-demand zones.
Enhances consistency: Apply a repeatable, data-driven approach to Smart Money trading.
Boosts efficiency: Quickly identify institutional zones across multiple charts.
Improves timing: Combine with market structure analysis to refine entries and exits.
By visually mapping institutional footprints, this tool helps traders stay one step ahead of reactive price movements.
For best results:
Install the indicator on MT4 and adjust your preferred color scheme.
Combine it with Smart Money Concepts (SMC) tools such as liquidity zones or BOS/CHOCH indicators.
Confirm trades using price action signals within the DBR or RBD zones.
You can find detailed setup instructions and complementary indicators on IndicatorForest.com.
The DBR-RBD Indicator for MT4 is an indispensable tool for traders focused on Smart Money, supply and demand, and institutional trading strategies. By automatically highlighting Drop-Base-Rally and Rally-Base-Drop zones, it streamlines your chart analysis and enhances trade accuracy.
Start identifying institutional footprints today — visit IndicatorForest.com to download the DBR-RBD Indicator and elevate your trading precision.
Published:
Oct 19, 2025 14:39 PM
Category: