The Three Line Break Indicator for MT4 is a price-action-based charting tool derived from traditional Japanese trading techniques. Unlike candlesticks or bar charts, the Three Line Break method focuses solely on closing prices and filters out insignificant market noise. This creates a clean, time-independent structure that displays only meaningful price movements. Traders use the Three Line Break Indicator to spot trend reversals, pullbacks, and momentum changes across any financial instrument, including forex, indices, and commodities.
This guide explains how the indicator works, how to interpret its buy/sell signals, and how you can apply it to your trading strategy.
What Is the Three Line Break Indicator?
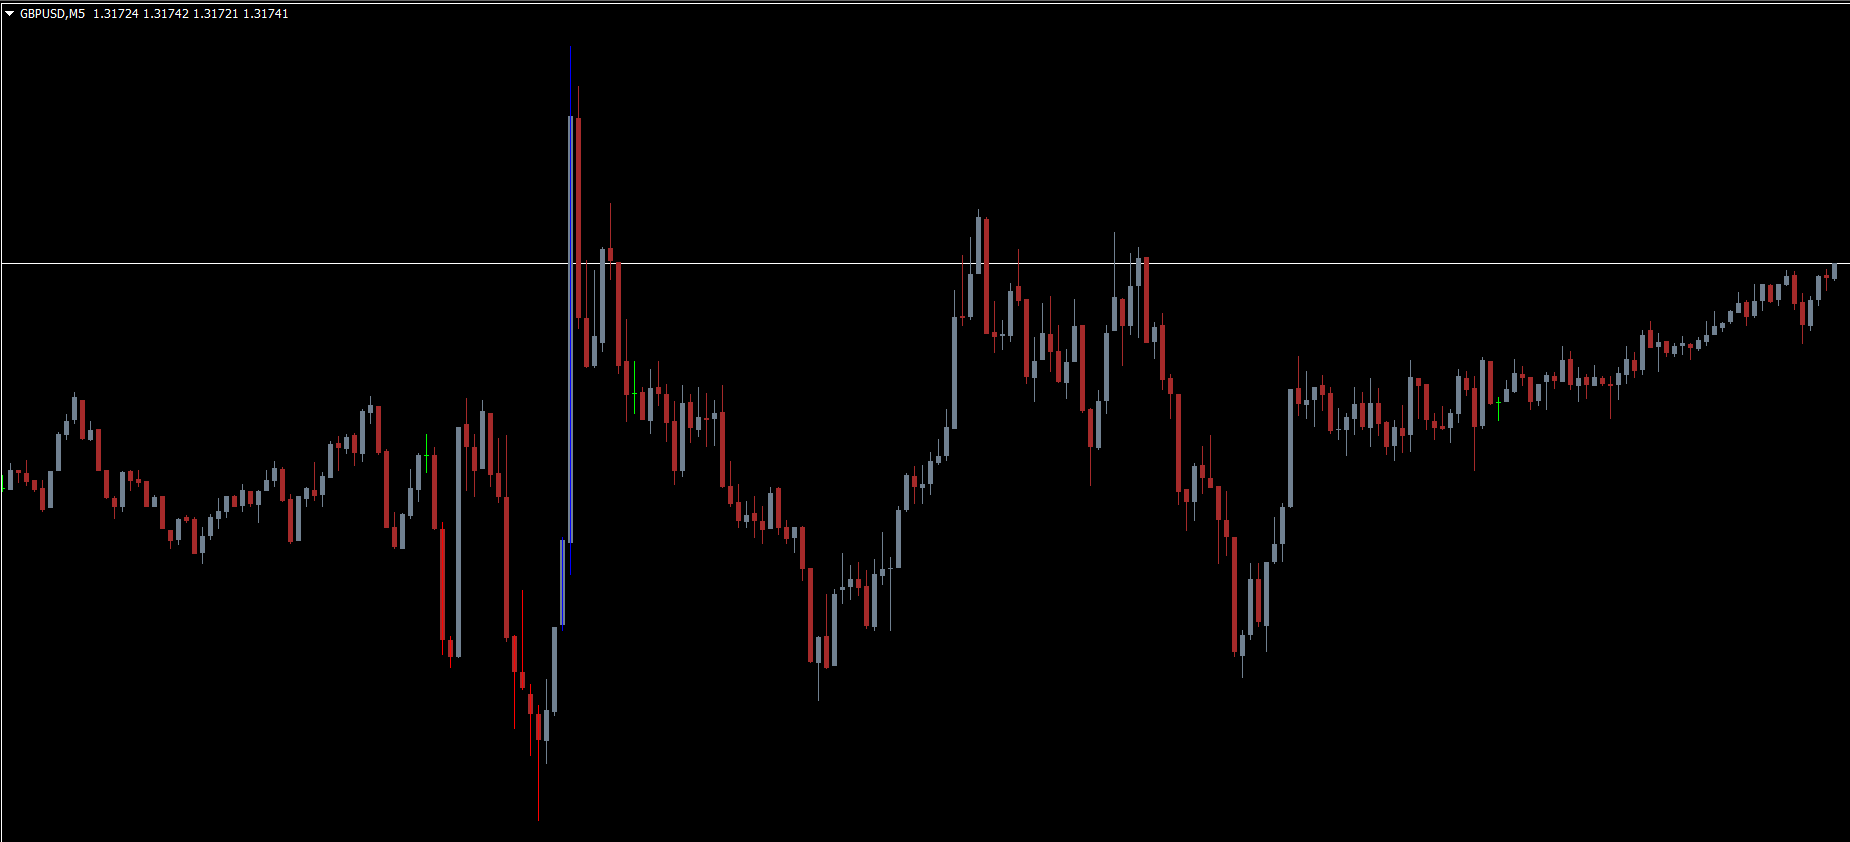
The Three Line Break Indicator forms a series of vertical lines based solely on closing prices. Each line represents a shift in market direction or continuation of the prevailing trend. Time intervals do not influence the chart—only the price movement does.
The indicator plots:
Bullish lines when the closing price surpasses previous highs
Bearish lines when the closing price breaks previous lows
Because it filters out small fluctuations, the Three Line Break chart is considered more reliable for detecting true market direction. It gives traders a simplified view of market sentiment without the distracting noise of traditional candlestick movements.
How the Three Line Break Indicator Works
The core concept behind the Three Line Break Indicator is the three-line reversal rule. The price must break above or below the previous three lines for a new reversal line to appear. This prevents false signals and helps traders focus on genuine price shifts.
The indicator automatically posts bullish or bearish signals, so traders do not need to manually track the three-line pattern. This makes the Three Line Break Indicator especially helpful for beginners learning to identify trend reversals.
How to Use the Three Line Break Indicator
How to Buy Using the Three Line Break Indicator
During an uptrend, wait for three consecutive bearish lines to appear. These lines represent a temporary pullback. Once a bullish line breaks above the three bearish lines, a bullish reversal is confirmed. Traders may enter long positions during this breakout.
How to Sell Using the Three Line Break Indicator
In a downtrend, wait for three bullish lines to form. These indicate a corrective movement against the trend. When a bearish line breaks below the three bullish lines, the downtrend resumes, providing a sell signal.
These logical entries make the indicator ideal for trend traders who rely on clean, rule-based setups.
Real Market Example: Three Line Break Trading
In the example of the EUR/NZD daily chart, the indicator generates a clear sell signal during a downtrend. The appearance of three bullish lines acts as the pullback, followed by a bearish break, confirming the continuation of the downtrend.
Similarly, the indicator provides buy signals during bullish markets. Traders simply follow the indicator’s visual cues—enter on bullish breakouts and exit when a bearish reversal signal forms. This approach minimizes emotional decision-making and supports disciplined trading.
Advantages of the Three Line Break Indicator
The Three Line Break Indicator offers several benefits:
Filters out market noise
Provides clear and rule-based reversal signals
Works on all timeframes and instruments
Eliminates the reliance on time-based candles
Effective for both short-term and long-term strategies
Easy to use for beginners
These advantages make it a valuable addition to any trend-trading system.
Conclusion
The Three Line Break Indicator for MT4 is a powerful charting tool for identifying buy and sell signals based on clear price-break patterns. By focusing solely on meaningful price movements, it helps traders discover pullbacks, reversals, and trend continuations with precision. With its simple bullish and bearish line structure, the indicator becomes easy to integrate into any forex or technical trading strategy.
To download more premium and free MT4 indicators, visit IndicatorForest.com and explore our growing library of trading tools.
FAQ
Published:
Nov 15, 2025 10:38 AM
Category: