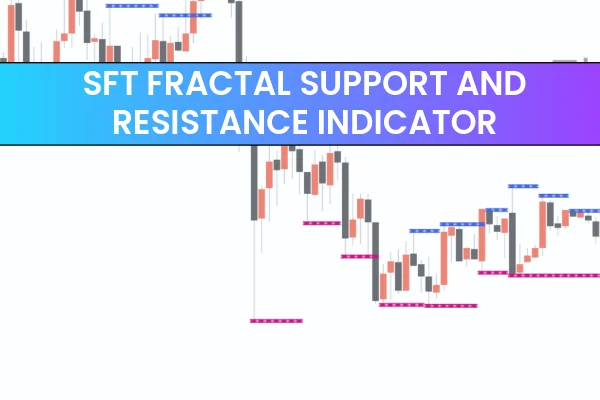
The core principle of trading is simple: buy low and sell high. To achieve this consistently, traders rely on tools that identify key highs and lows in the market. This is where the SFT Fractal Support and Resistance indicator becomes invaluable.
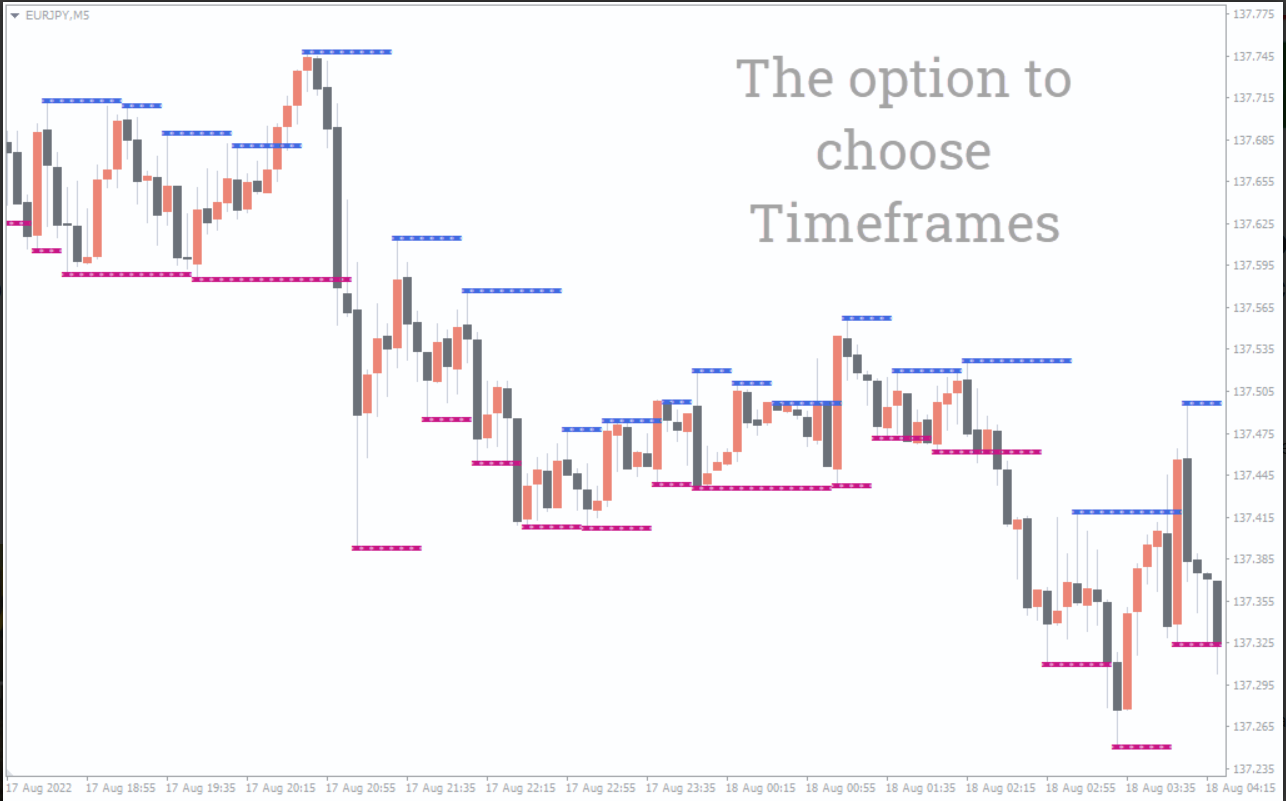
This non-repainting indicator automatically plots the highest and lowest price points, known as fractals. The upper fractal forms a resistance level, while the lower fractal becomes a support level. When price touches these levels, traders can anticipate potential market reversals. Because of its simplicity and reliability, the indicator is suitable for both beginner and experienced traders. It provides clear signals useful for manual trading and can also be integrated into automated trading systems and expert advisors.
How to Trade Using the SFT Fractal Support and Resistance Indicator
Using this indicator is straightforward. When the price reaches the resistance line, traders should prepare for a possible selling opportunity. Conversely, long positions are considered when the price touches the support line. These levels act as natural barriers where price often reacts, making them ideal for finding reversal setups.
SFT Fractal Support and Resistance Trading Example
In the example based on the USD/JPY currency pair, the indicator highlights major price highs and lows. The market often reverses around these key levels. A downtrend is likely to pause or reverse after touching a significant support (a lower fractal). Similarly, an uptrend may turn bearish once price hits a strong resistance (an upper fractal). For better accuracy, traders should wait for a confirmation candlestick pattern or momentum signal once the indicator plots a fractal level.
Conclusion
The SFT Fractal Support And Resistance indicator is an effective tool for identifying market highs and lows. By marking key reversal zones, it helps traders anticipate turning points and enter trades as new trends begin. Whether you trade manually or through automated systems, this indicator enhances your ability to make informed decisions based on Market Structure.
FAQ
3 Downloads
Published:
Nov 14, 2025 21:31 PM
Category: