The CCI Divergence Indicator is one of the most effective tools for identifying trend reversals in the financial markets. Traders rely on divergence analysis to spot early turning points, and the CCI Divergence Indicator simplifies this process with visual signals. When applied correctly, the indicator helps traders detect hidden and regular divergences between price movement and the Commodity Channel Index, making it a valuable tool for both beginners and advanced market participants.
How the CCI Divergence Indicator Works
The CCI Divergence Indicator compares swings in market price with movements in the CCI oscillator. When price and indicator values move in opposite directions, a divergence forms—often signaling a high-probability reversal.
Understanding Bullish and Bearish Divergence
Hidden bullish divergence appears when price forms higher lows, but the CCI creates lower lows. This pattern suggests an underlying strength in the market.
Hidden bearish divergence occurs when price makes lower highs, while the CCI forms higher highs—indicating potential weakness and a probable downtrend continuation.
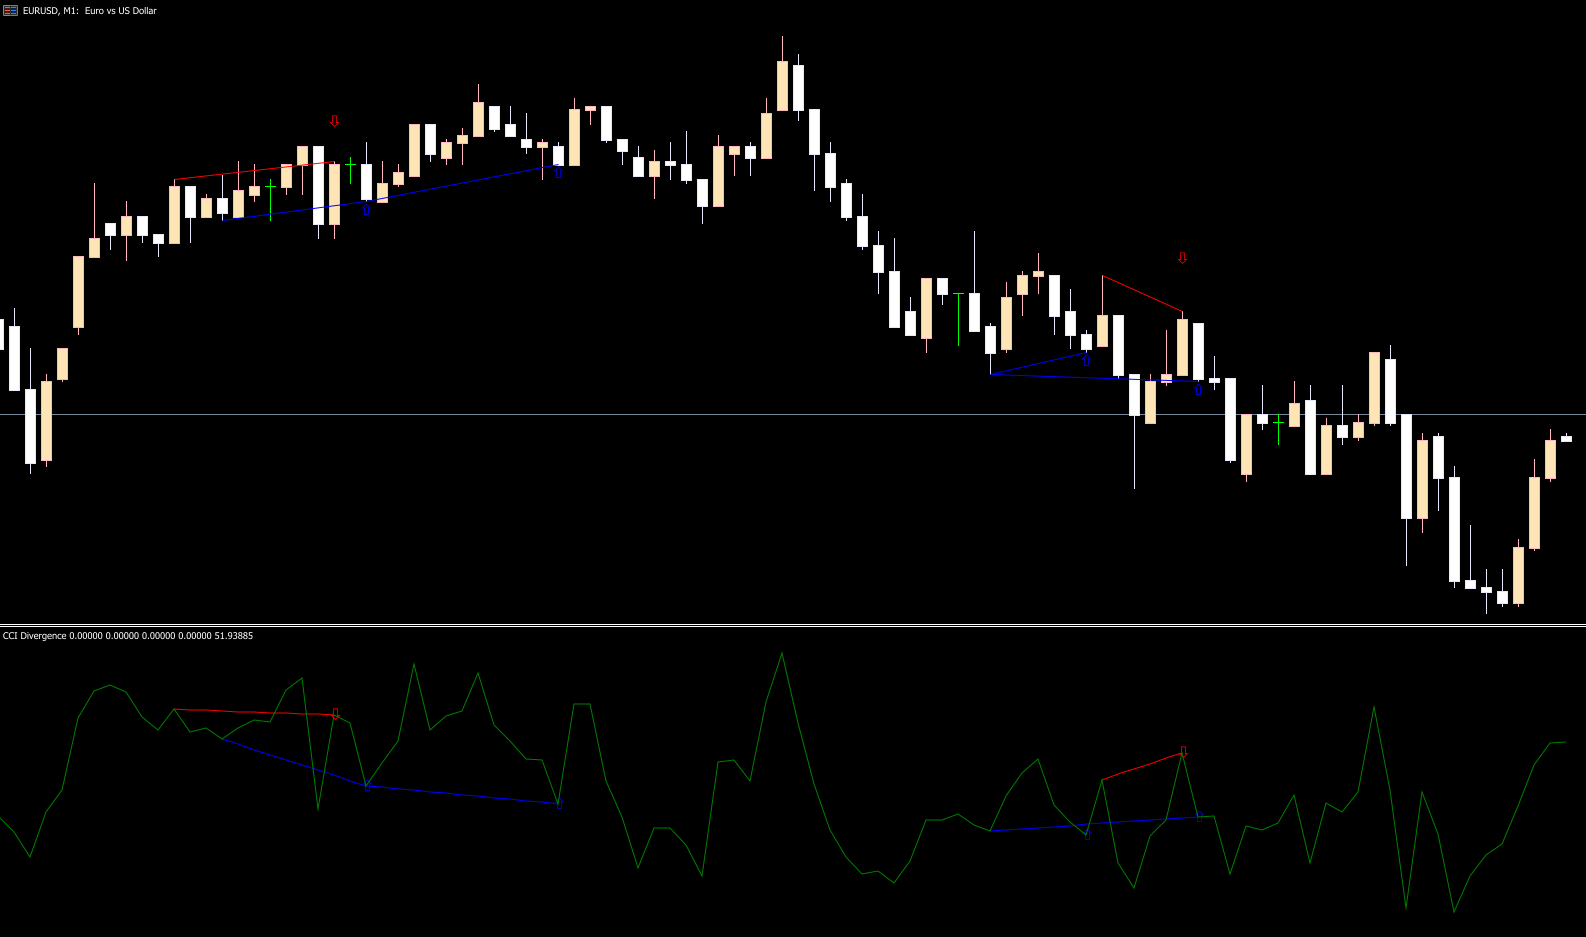
The indicator visually marks these signals on the chart. Blue arrows represent bullish divergence, while red arrows highlight bearish divergence. These visual cues simplify the detection process and eliminate confusion, especially during fast-moving markets.
Practical Example of CCI Divergence
When applied to pairs like EUR/USD on a daily chart, the CCI Divergence Indicator clearly identifies strong reversal zones. Red arrows highlight overextended uptrends likely to reverse, while blue arrows hint at bullish recovery areas. Green histogram bars indicate strong buying pressure, whereas red bars confirm bearish momentum.
This contextual visualization helps traders make informed entry and exit decisions, improving accuracy and reducing emotional trading errors.
Trading Strategies Using the CCI Divergence Indicator
Long (Buy) Strategy
Enter a long position when the indicator prints a blue bullish divergence arrow. This setup suggests that buyers are regaining control and a trend reversal may be starting. Stops can be placed below the nearest swing low.
Short (Sell) Strategy
A red bearish divergence arrow signals an opportunity to go short. Place stops above recent price highs to minimize risk. These divergence signals often serve as early warnings before momentum shifts.
Best Timeframes for CCI Divergence
While the indicator works on all timeframes, it performs best on:
M15 and above for reliable signals
H1 and H4, where noise is minimal and divergence patterns are cleaner
On low timeframes like M1 or M5, the indicator may produce excessive signals, leading to confusion or poor entries. Therefore, traders seeking accuracy should focus on higher timeframe setups.
Why the CCI Divergence Indicator Is Ideal for Reversal Traders
Divergence-based strategies are popular because they warn traders of potential market turning points before price fully reacts. The CCI Divergence Indicator simplifies this by:
Automatically detecting divergence
Displaying clear visual signals
Providing actionable insights for entries and exits
Filtering false signals with histogram color shifts
Whether you are a novice or an experienced trader, this indicator fits seamlessly into a technical analysis toolkit.
Tips for Effective Use
Although the CCI Divergence Indicator is powerful, it should not be used alone. Combine it with other tools such as moving averages or trendlines to confirm market direction. Always apply appropriate risk management—stop losses and proper position sizing are essential for long-term success.
Conclusion
The CCI Divergence Indicator is among the best tools for spotting reversals and timing entries with precision. Its clear divergence signals help traders predict shifts in market direction before they happen. For traders who want accuracy, reliability, and an easy-to-read system, this indicator is an excellent choice.
To explore more trading tools and download high-quality indicators, visit IndicatorForest.com today.
FAQ
Published:
Nov 24, 2025 02:33 AM
Category: