Precision Cycle Analysis: The FTLM STLM Indicator for MT5
In the modern trading landscape, static indicators often fail to account for the dynamic nature of market cycles. Traders who rely solely on traditional moving averages frequently find themselves entering trades just as a trend exhausts itself. The FTLM STLM Indicator (Fast and Slow Trend Line Momentum) is a professional-grade technical suite for MetaTrader 5 that utilizes digital spectral analysis to isolate short-term and long-term price cycles with surgical precision.
The Science of Digital Filters in Trading
The FTLM and STLM are not standard oscillators; they are based on digital filter theory used in signal processing. The system consists of two primary components that work in tandem to provide a comprehensive view of market momentum:
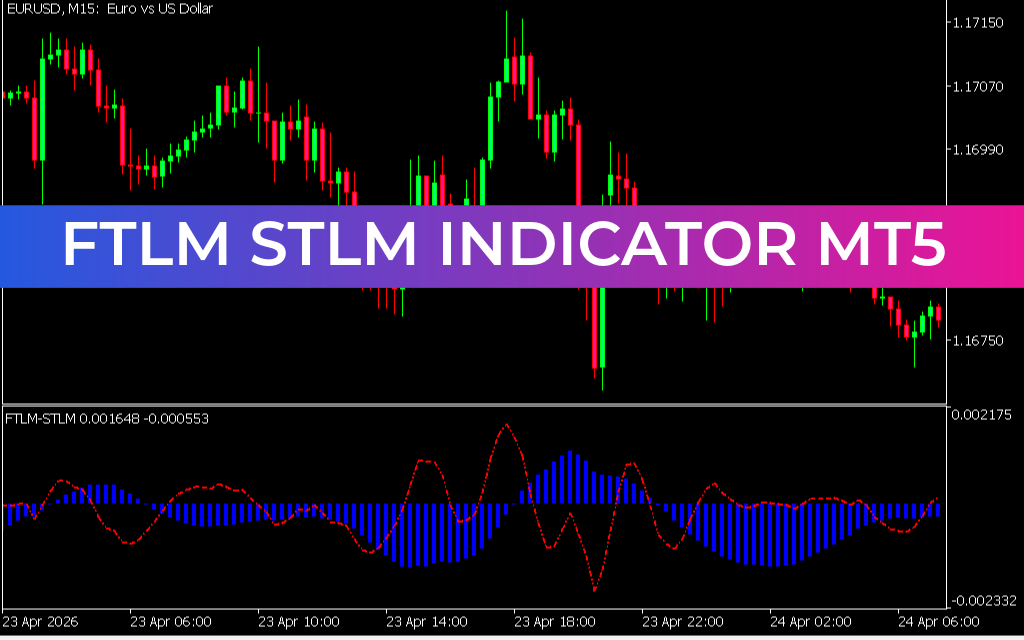
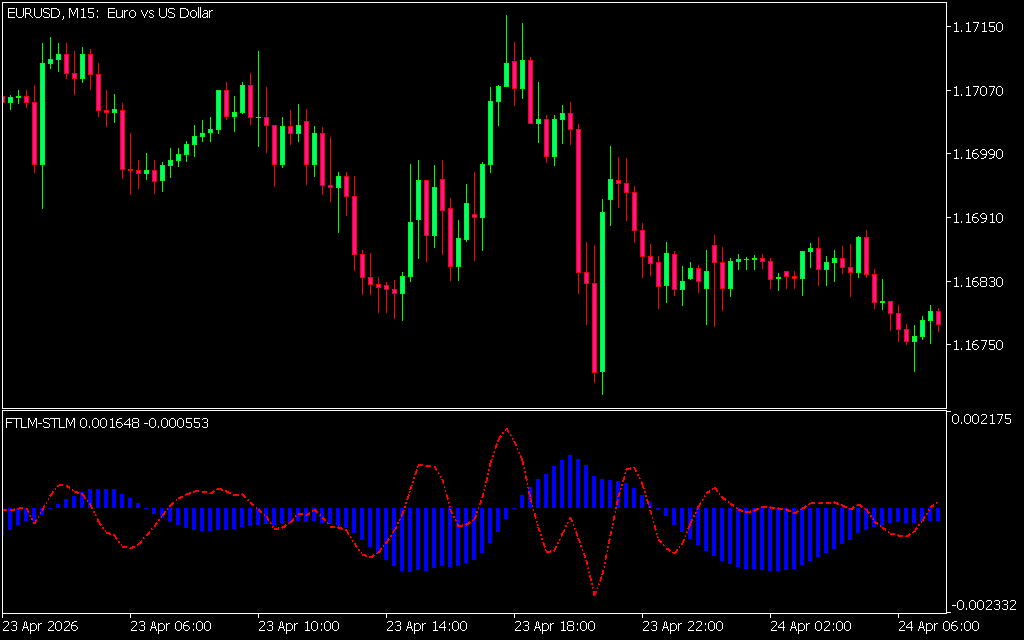
- FTLM (Fast Trend Line Momentum): This component describes the "short-term" cycle. It is designed to react quickly to price changes, helping traders identify local peaks and troughs. As seen in the EURUSD M15 chart, the FTLM is represented by the red dashed line that moves fluidly around the histogram.
- STLM (Slow Trend Line Momentum): This represents the "long-term" or "major" trend. In the sub-window, the STLM is visualized as the blue histogram bars. When the histogram is above the zero line, the major trend is bullish; when below, it is bearish.
Strategic Execution and Confluence
The power of the FTLM STLM system lies in the interaction between these two filters. By comparing the fast cycle to the slow cycle, traders can identify high-probability entry points based on momentum convergence.
- Trend Confirmation: A high-conviction "Buy" signal occurs when both the STLM histogram and the FTLM line are above the zero line and rising. This confirms that both the short-term and long-term participants are in agreement.
- Early Exhaustion Warning: If the price continues to rise but the FTLM line begins to curve downward while the STLM histogram starts to shrink, it indicates a "divergence" in cycles. This is an early warning that the current trend is losing internal strength and a reversal or consolidation is likely.
- Zero-Line Crossovers: The most aggressive signals are generated when the STLM histogram flips from negative to positive. This marks the mathematical birth of a new major trend.
Why Professional Traders Prefer FTLM STLM
Unlike lagging indicators, digital filters like FTLM and STLM are designed to reduce "phase lag." This means the signals appear closer to the actual price turning points. On the EURUSD M15 chart, you can observe how the blue histogram accurately depicts the shifting waves of market sentiment, allowing traders to stay on the right side of the market during both volatile spikes and steady trends.
By integrating the FTLM STLM Indicator into your MT5 terminal, you are moving away from reactive trading and toward predictive analysis. It provides a clear, mathematical framework for understanding market cycles, enabling you to execute trades with the discipline and clarity of an institutional analyst.
2 Downloads
Last Update:
Apr 27, 2026 15:26 PM
Published:
Feb 01, 2026 19:46 PM
Category: