Unlock Precision Market Levels with the Pulse Fibonacci Pivot Indicator for MT4
In the world of professional trading, price action rarely moves in a vacuum. It reacts to hidden levels of psychological Support And Resistance that have been respected for decades. Among the most reliable methods for identifying these "hidden" zones are Pivot Points and Fibonacci Retracements. The Pulse Fibonacci Pivot Indicator for MetaTrader 4 (MT4) seamlessly merges these two mathematical powerhouses into a single, automated tool that provides a clear roadmap for every trading day.
The Synergy of Fibonacci and Pivot Points
Standard Pivot Points use the previous day's High, Low, and Close to calculate support and resistance levels. The Pulse Fibonacci Pivot Indicator takes this a step further by using Fibonacci ratios—specifically the 38.2%, 61.8%, and 100% levels—to determine the distance of the support and resistance lines from the central pivot. This creates a much more nuanced view of Market Structure that aligns with institutional order flow.
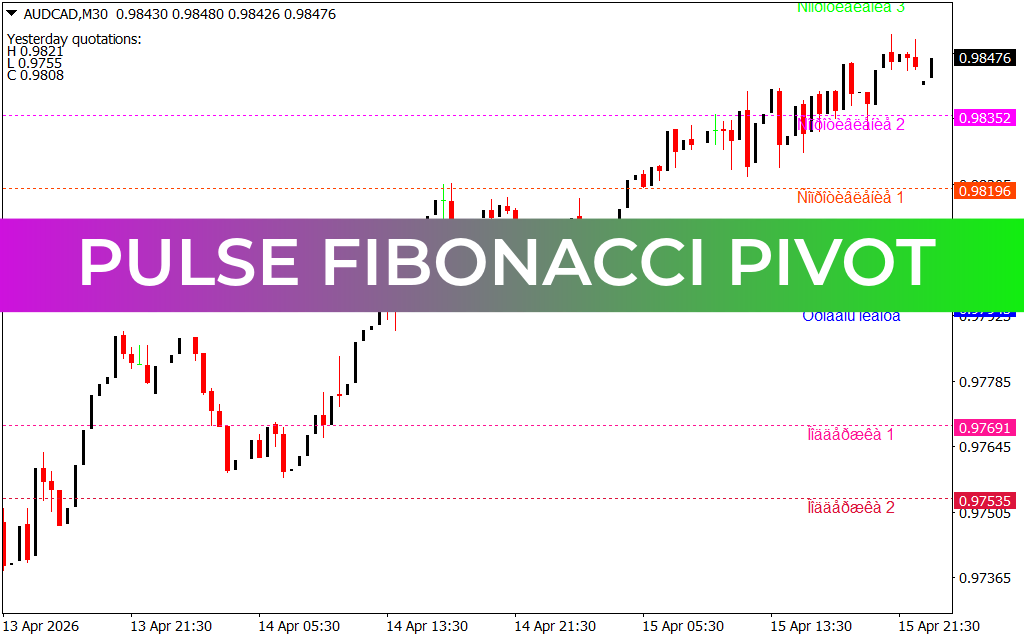
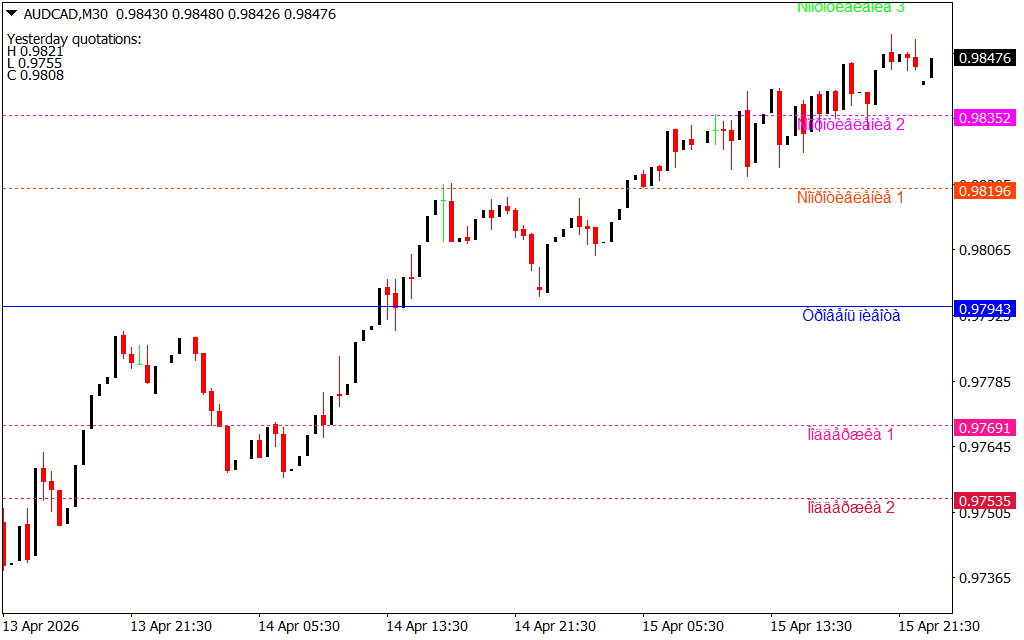
As seen in the recent AUD/CAD M30 chart analysis, the indicator provides a clean, horizontal grid of high-probability reaction zones:
- The Central Pivot (Blue Line): This is the "fair value" of the market. If price is trading above the blue line, the daily bias is bullish; if below, the bias is bearish.
- Resistance Levels (Orange/Purple Lines): Labeled as R1, R2, and R3, these levels mark the points where bullish momentum is likely to stall. They are prime locations for taking profits on long positions or looking for bearish reversal patterns.
- Support Levels (Pink/Red Lines): Labeled as S1, S2, and S3, these act as the "floor" for Price Action. Traders use these zones to find high-probability buy entries during a retracement.
- Yesterday's Data: The indicator conveniently displays the previous day's High, Low, and Close in the top-left corner, giving you the raw data behind the calculations.
Strategic Advantages for Intraday Traders
The Pulse Fibonacci Pivot Indicator is a definitive tool for traders who value mathematical objectivity over subjective "gut feelings."
- Automated Daily Calculation: You no longer need to manually calculate levels at the start of every session. The indicator updates automatically as soon as the new daily candle opens, ensuring you are ready for the London or New York sessions.
- Confluence Discovery: When a Fibonacci Pivot level aligns with a major moving average or a supply/demand zone, it creates a "Confluence Zone." These are the highest probability setups in the market.
- Objective Risk Management: These levels provide perfect locations for stop-loss placement. For example, a common professional tactic is to place a stop-loss just below the S1 level when entering a long trade at the Central Pivot.
- Optimized for M30 and H1: While it works on all timeframes, it is exceptionally powerful on the M30 chart. It helps day traders visualize the daily range without the noise of lower timeframes.
Conclusion
The Pulse Fibonacci Pivot Indicator for MT4 is an essential piece of software for any trader who wants to trade like the institutions. By combining the historical reliability of Pivot Points with the mathematical harmony of Fibonacci ratios, it provides a stable and predictable framework for the Forex market. Elevate your technical analysis today and start trading with the precision that only the Pulse Fibonacci Pivot can provide.
2 Downloads
Last Update:
Apr 16, 2026 02:39 AM
Published:
Feb 11, 2026 13:26 PM
Category: